Le 10 migliori piattaforme di business intelligence nel 2026

10 Migliori Piattaforme di Business Intelligence: La Shortlist


Con così tante diverse piattaforme di business intelligence disponibili, capire quale sia la più adatta a te è una sfida. Sai di voler sfruttare i tuoi dati per ottenere vantaggi strategici, migliorare le operazioni e far crescere la tua azienda, ma devi capire quale strumento sia il migliore. Sono qui per aiutarti! In questo articolo ti aiuterò a semplificare la scelta, condividendo le mie esperienze personali nell'utilizzo di decine di strumenti di business intelligence con diversi team e database, insieme alle mie scelte delle migliori piattaforme BI.
Perché Fidarti delle Nostre Recensioni sulle Piattaforme di Business Intelligence?
Testiamo e recensiamo le piattaforme di business intelligence dal 2022. Essendo noi stessi responsabili delle revenue operation, sappiamo quanto sia fondamentale e difficile prendere la decisione giusta nella scelta del software.
Investiamo in ricerche approfondite per aiutare la nostra audience a prendere decisioni migliori negli acquisti di software. Abbiamo testato oltre 2.000 strumenti per diversi casi d'uso RevOps e scritto più di 1.000 recensioni approfondite di software. Scopri come manteniamo la trasparenza & il nostro metodo di valutazione delle piattaforme di business intelligence.
Table of Contents
- Migliori software selezionati
- Perché fidarsi di noi?
- Confronta specifiche
- Recensioni
- Altre piattaforme di business intelligence
- Recensioni correlate sulle piattaforme di business intelligence
- Criteri di selezione
- Come scegliere
- Tendenze nelle piattaforme di business intelligence
- Cosa sono le piattaforme di business intelligence?
- Funzionalità
- Vantaggi
- Costi e prezzi
- Domande frequenti
| Tool | Best For | Trial Info | Price | ||
|---|---|---|---|---|---|
| 1 | Best for live BI reporting in spreadsheets | Free plan available | From $49/month (billed annually) | Website | |
| 2 | Best for extensive data integration | 15-day free trial + free plan + free demo available | From $24/month (billed annually) | Website | |
| 3 | Best for automated reporting without an analyst | Free plan available | From $29/month | Website | |
| 4 | Best for accelerating decision-making with the help of AI | Free plan available | From $15/user/month (billed annually) | Website | |
| 5 | Best for automated data transformation | Free demo available | Pricing upon request | Website | |
| 6 | Best for using automated SQL generation | 14-day free trial + free demo available | From $13/user/month | Website | |
| 7 | Best for business analysts and data scientists | 30-day free trial | From $125/user/month (billed annually) | Website | |
| 8 | Best for web-based data modeling solutions | 30-day free trial available | From $11.25/user/month | Website | |
| 9 | Best for end-to-end enterprise performance management | 30-day free trial + free demo available | Pricing upon request | Website | |
| 10 | Best for enterprise-grade self service to increase user autonomy | Free demo available | Pricing upon request | Website |
-

Prisync
Visit WebsiteThis is an aggregated rating for this tool including ratings from Crozdesk users and ratings from other sites.4.7 -
Expedite Commerce
Visit Website -
QuickBooks Online
Visit WebsiteThis is an aggregated rating for this tool including ratings from Crozdesk users and ratings from other sites.4


Recensioni delle Migliori Piattaforme di Business Intelligence
Sei pronto a scoprire i migliori strumenti di business intelligence della mia lista? Continua a leggere per conoscere i riepiloghi delle piattaforme, le caratteristiche principali, i prezzi, le informazioni sulle prove gratuite e alcuni pro e contro di ciascuna soluzione. Ho anche incluso informazioni sulle integrazioni per aiutarti a capire se un tool può integrarsi nel tuo stack tecnologico.
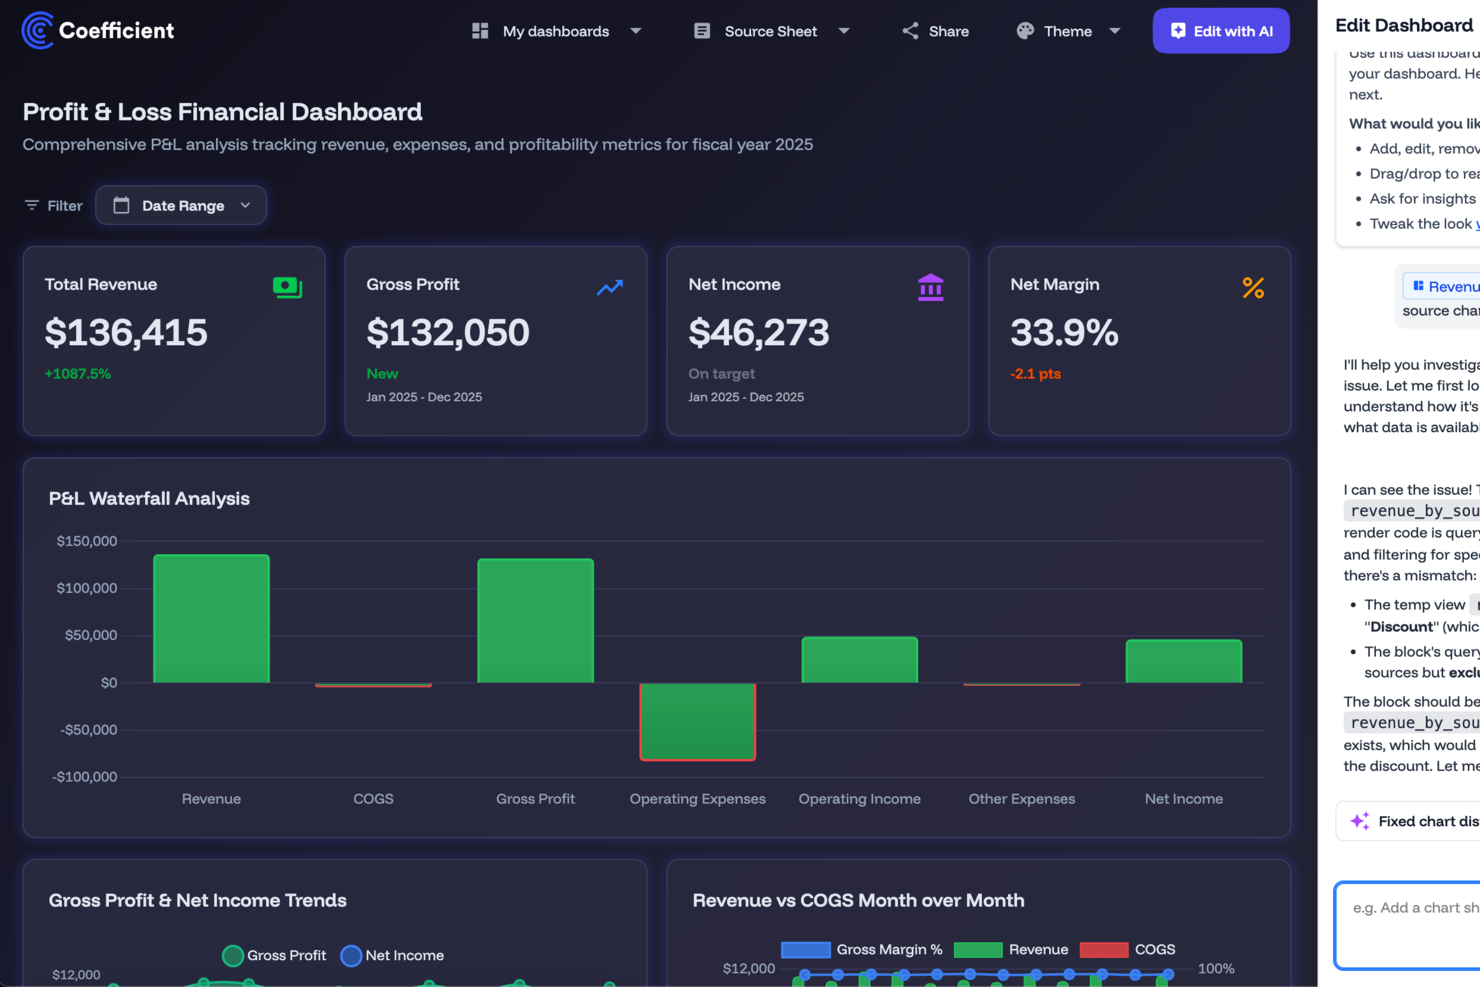
Coefficient is a spreadsheet-native BI tool that pulls live data from CRMs, databases, and data warehouses directly into Google Sheets and Excel for real-time reporting, dashboards, and analysis.
Who Is Coefficient Best For?
Coefficient is a good fit for RevOps and sales ops teams who already live in spreadsheets and need live CRM and pipeline data without rebuilding their reporting in a new tool.
Why I Picked Coefficient
I've included Coefficient in my top picks because it closes the gap between where data lives and where most BI work actually happens: spreadsheets. I like that live data from sources like Salesforce or Snowflake auto-refreshes on a schedule, so my reports reflect current pipeline or revenue numbers without manual exports. The AI-powered pivot and chart builder lets me go from raw CRM data to a formatted dashboard inside Google Sheets in minutes, which I've found genuinely useful when stakeholders want answers fast.
Coefficient Key Features
- Data snapshots: Capture point-in-time records of live data to track changes and trends over time directly in your spreadsheet.
- Slack and email alerts: Set threshold-based alerts that notify your team when key metrics hit defined conditions.
- Two-way writeback: Push data edits made in Google Sheets or Excel back to the connected source system without leaving your spreadsheet.
- 150+ pre-built connectors: Link CRMs, data warehouses, databases, and marketing platforms without writing code.
Pros and Cons
Pros:
- Custom connectors allow integration with unique data sources
- Automated alerts via Slack or email keep teams informed
- User-friendly interface requires minimal training to operate
Cons:
- Hourly automated refreshes limited to higher-tier plans
- Fewer advanced BI features than enterprise competitors

Zoho Analytics is a self-service BI and analytics platform that covers the full data pipeline—from connecting 500+ data sources and preparing data to building interactive dashboards, running predictive analysis, and embedding analytics into your own apps.
Who Is Zoho Analytics Best For?
Zoho Analytics is a good fit for data and operations teams at mid-sized businesses that need to consolidate data from across a wide stack of tools into a single analytics layer.
Why I Picked Zoho Analytics
Zoho Analytics is one of my top picks because I love the sheer breadth of its data connectivity. You can pull live data from databases, cloud storage, files, and dozens of business apps spanning CRM, marketing, finance, HR, and ecommerce—all from one platform. The no-code custom connector builder lets you connect apps that aren't already covered by a native integration. Zoho Flow automates data imports from 1,000+ additional apps to keep reports current without manual refreshes.
Zoho Analytics Key Features
- Ask Zia: A conversational AI assistant that lets you query your data in plain language and returns charts, summaries, and insights without writing any SQL.
- AutoML model builder: A built-in tool for training, evaluating, and deploying custom machine learning models directly on your datasets using a no-code interface.
- What-if analysis: A scenario modeling tool that lets you adjust variables in your data to simulate different outcomes and visualize the impact on your metrics.
- Embedded analytics: A white-labeled analytics layer you can embed directly into your own product or internal apps with full dashboard and reporting functionality.
Pros and Cons
Pros:
- Can integrate with many data sources, including on-premise systems
- Excellent visual representation of data
- Live, customizable dashboards
Cons:
- Mobile app sometimes has delayed notifications
- Potential learning curve when customizing dashboards
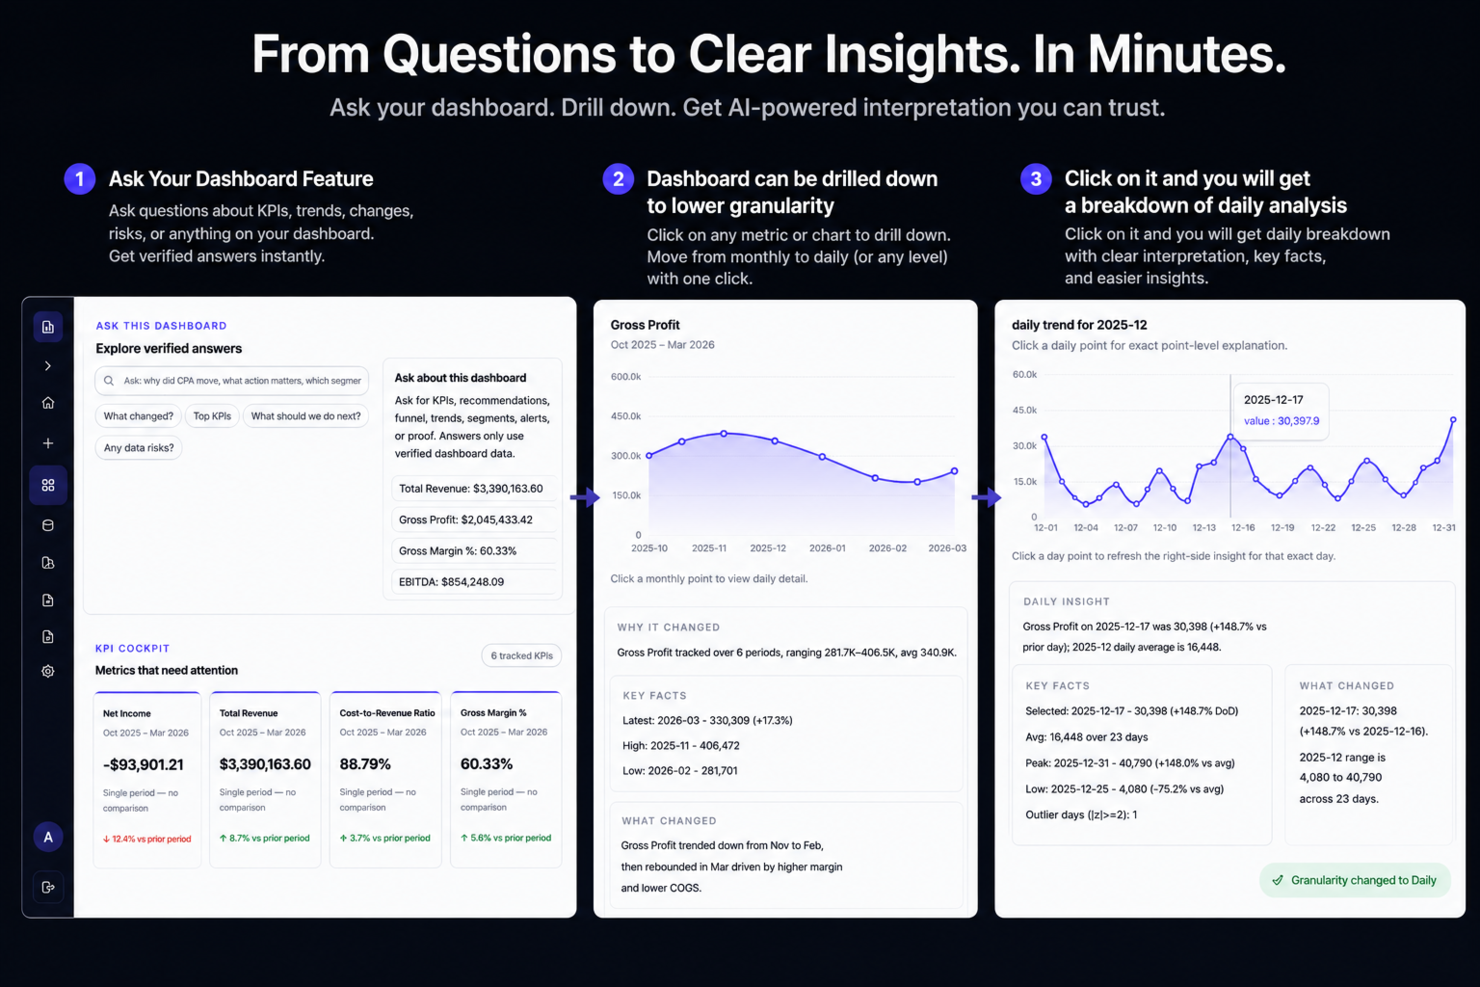
Signara is an agentic analytics platform for growing businesses. Plug in your data and Signara automatically generates dashboards, KPI narratives, and recommended next steps, no data analyst or engineer needed. The math is deterministic, so the numbers are ones you can trust. Connects to HubSpot, Snowflake, BigQuery, and more.
Who Is Signara Best For?
Signara is a good fit for marketing and revenue teams at small to mid-sized companies that need automated reporting without a dedicated data analyst on staff.
Why I Picked Signara
I've included Signara in my top picks because it pulls from both live operational data sources and file-based inputs in one place. I connect a live Snowflake or BigQuery warehouse alongside an Excel upload, and Signara's deterministic KPI engine runs consistent, auditable math across all of it. I especially like the driver analysis layer, which surfaces what moved across those blended sources and by how much, without me needing to manually reconcile anything.
Signara Key Features
- AI narrative generation: Automatically writes commentary on what changed across your KPIs, using consulting-grade frameworks tuned to marketing, FP&A, and revenue reporting.
- Full audit trail: Every figure in a generated narrative links back to its computed source, so you can trace any number to its origin in the raw data.
- PPTX and dashboard output: Generates both an interactive dashboard and a downloadable PowerPoint deck from the same analysis run.
- Decision framing: Surfaces prioritized next-step recommendations alongside each report, categorized by growth opportunities, watch items, and actions.
Signara Integrations
Signara offers native connectors to HubSpot, Snowflake, Databricks, BigQuery, MySQL, and Google Sheets, and also accepts file-based uploads from Excel and CSV sources.
Pros and Cons
Pros:
- Auto-generates board-ready PPTX decks
- Deterministic math prevents number inconsistencies
- AI generates narrative explanations automatically
Cons:
- No mobile app for on-the-go access
- Limited connector library for data sources

Tableau is a visual analytics and business intelligence platform that lets you connect to data sources, build interactive dashboards, apply AI-powered analysis, and share insights across your organization.
Who Is Tableau Best For?
Tableau is a strong fit for data analysts and BI teams at mid-size to enterprise organizations that need to explore and visualize large, complex datasets.
Why I Picked Tableau
I've included Tableau in my top picks because its AI capabilities are genuinely built into the analysis workflow, not bolted on. Tableau Pulse delivers personalized, AI-generated metric digests directly in Slack or Microsoft Teams, surfacing the "why" behind KPI changes without anyone pulling a report. I also like Tableau Agent, which lets you type a natural language prompt and get a calculated field, a pivot, or a finished visualization in seconds.
Tableau Key Features
- Drag-and-drop dashboard builder: Create interactive, multi-chart dashboards by dragging dimensions and measures onto a canvas without writing code.
- Tableau Prep Builder: Clean, reshape, and combine data from multiple sources using a visual, step-by-step flow before it hits your dashboards.
- Live and extract data connections: Query data live from your source or pull an extract for faster, offline analysis.
- Row-level security: Control which users see which rows of data directly within Tableau, without modifying the underlying database.
Pros and Cons
Pros:
- Can handle large data sets
- Allows for custom SQL
- Supports almost all connectors
Cons:
- Overall UI could be better
- The server can be a bit slow
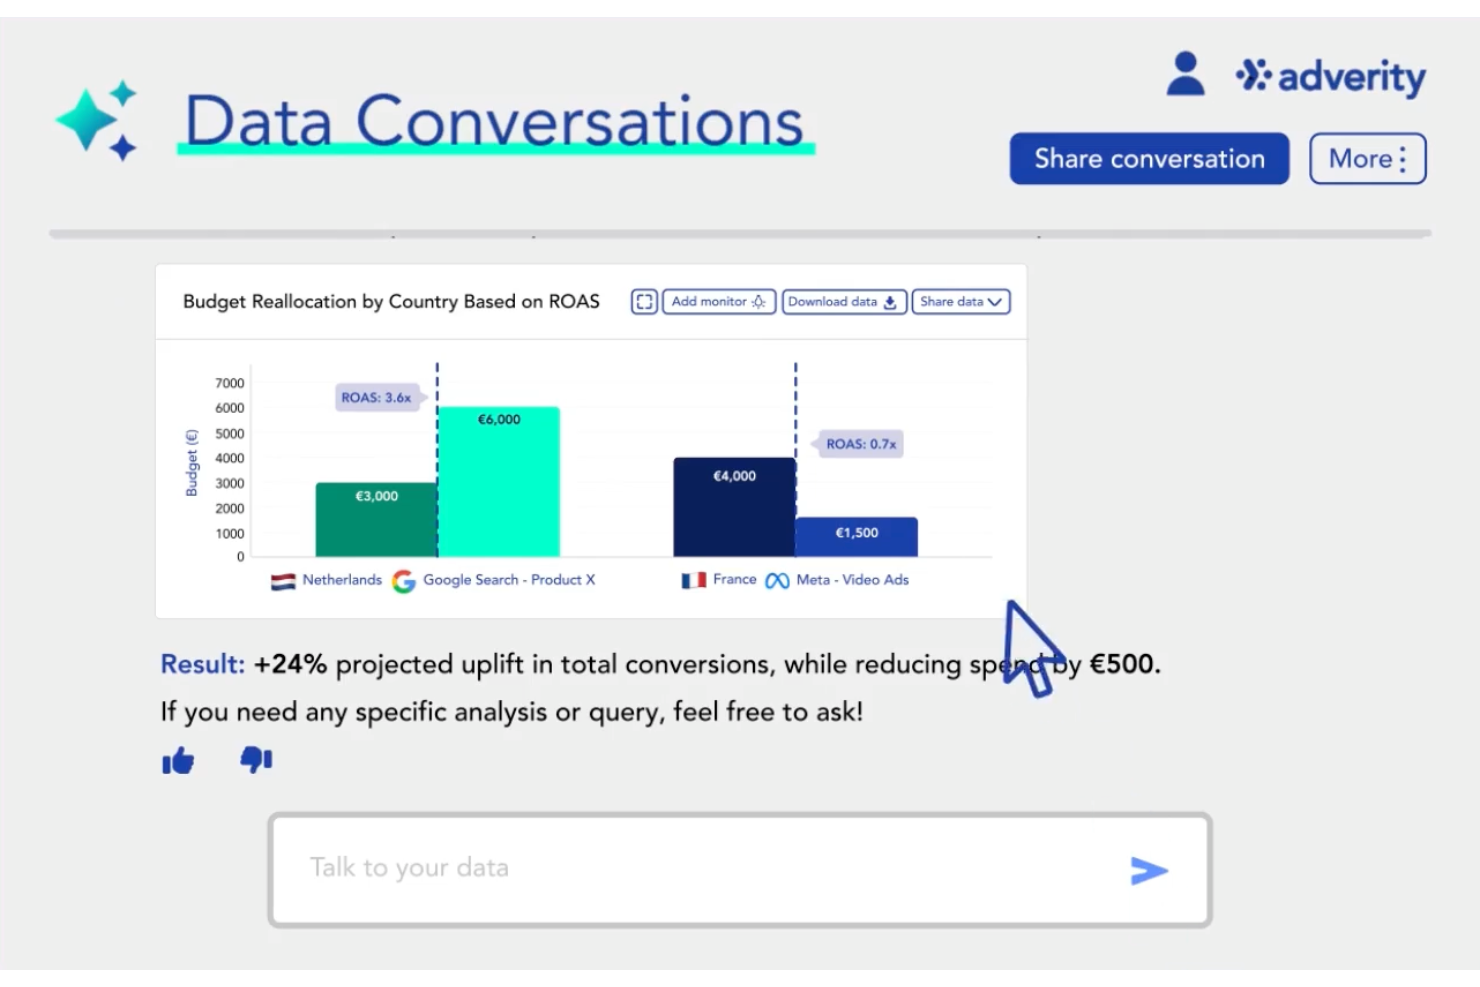
Adverity is a marketing data integration and analytics platform that combines data ingestion from 600+ sources with ETL/ELT transformation, data quality monitoring, and AI-powered querying to give revenue and analytics teams a unified, analysis-ready data layer.
Who Is Adverity Best For?
Adverity is a strong fit for mid-to-enterprise marketing and data teams managing high volumes of fragmented data across paid media, CRM, and e-commerce platforms.
Why I Picked Adverity
I included Adverity in my top picks because its AI-powered transformation copilot stands out. Instead of writing transformation logic manually, you describe what you need in plain language and Adverity builds it for you. I also like the Smart Data Dictionary, which automatically maps metrics and dimensions across all your sources and maintains full data lineage. The real-time transformation preview lets you test changes live on your dataset before committing, reducing debugging later.
Adverity Key Features
- Data quality suite: Get a single dashboard view of quality metrics across your warehouse, with automated monitors for duplication, volume, validity, and consistency issues.
- Smarter scheduling: Adverity automatically adjusts data fetch times based on real-time API conditions and historical trends, so your data refreshes without manual intervention.
- dbt integration: Schedule and monitor dbt model executions directly within Adverity, with job status notifications for tracking and troubleshooting.
- Multi-destination data push: Send data to multiple destinations simultaneously, keeping everything in sync across your entire tech stack.
Pros and Cons
Pros:
- Reliable cross-platform data transfers for large marketing and advertising datasets
- Responsive support team helps resolve integration and pipeline configuration issues
- Pre-built connectors simplify integrating marketing and analytics data sources
Cons:
- Managing large-scale pipelines can become time-consuming during setup
- Complex onboarding process for configuring connectors and data pipelines
New Product Updates from Adverity
Adverity Enhances Connectors and Adds TikTok GMV Max
Adverity updates connectors for Amazon Ads, SmartNews Ads, Indeed, and monday.com, and introduces the TikTok GMV Max connector. These updates improve data accuracy, control, and performance across integrations. For more information, visit Adverity’s official site.
 .
.
Strategy (formerly MicroStrategy) is an enterprise BI and analytics platform built around a universal semantic layer that unifies data across cloud, on-prem, and hybrid environments, with capabilities spanning governed dashboards, AI-powered analytics, embedded intelligence, and automated SQL generation.
Who Is MicroStrategy Best For?
Strategy is a strong fit for large enterprises and data-heavy organizations that need governed, scalable analytics across complex, multi-source data environments.
Why I Picked MicroStrategy
Strategy (formerly MicroStrategy) is on my shortlist because Auto SQL is an AI-integrated tool within the schema editor built specifically for SQL generation and editing. My team can describe a data need in plain language and Auto SQL produces the Freeform SQL table definition, removing a bottleneck when working with complex, multi-table schemas. It also provides optimization recommendations for specific databases like Snowflake, helping match SQL conventions to the target platform. Context-aware generation inside the schema editor, rather than in a separate tool, makes it useful for enterprise BI workflows.
MicroStrategy Key Features
- Universal semantic layer: Mosaic connects to 200+ data sources across cloud, on-prem, and hybrid environments without moving data, applying consistent metric definitions across every report.
- Auto Answers: A natural language Q&A feature that lets users ask data questions in plain text and receive instant, governed answers directly within dashboards.
- HyperIntelligence: Injects contextual, card-based analytics into web apps and SaaS tools users already work in, without requiring them to leave those tools.
- Embedded analytics: Lets you embed governed dashboards and reports into external products, portals, or internal apps while enforcing existing security rules.
Pros and Cons
Pros:
- Quick implementation and installation
- Intuitive user navigation
- Easy to learn the tools
Cons:
- Platform isn’t as responsive on smaller screens
- Cost is higher than other tools

TIBCO Spotfire is an industrial analytics and business intelligence platform that combines visual data exploration, predictive analytics, machine learning, and explainable AI to support expert-driven decision-making across complex, data-intensive environments.
Who Is TIBCO Spotfire Best For?
TIBCO Spotfire is well-suited for enterprise teams in data-heavy industries like manufacturing, energy, life sciences, and financial services.
Why I Picked TIBCO Spotfire
I've included TIBCO Spotfire in my top picks because it provides business analysts and data scientists a single environment where visual exploration, machine learning, and explainable AI work side by side. I particularly like how it handles fragmented industrial data—connecting time-series signals, spatial context, and historical events into a shared analytical view without requiring analysts to stitch together separate tools. The AI-assisted analysis features surface patterns and evaluate potential outcomes while keeping domain expertise in the loop, which is important for high-stakes process and production data.
TIBCO Spotfire Key Features
- Geospatial analytics: Build multi-level, map-based visualizations that layer location data alongside process, production, or operational data for geographic pattern analysis.
- Natural language query: Search your data using plain-language queries to find data sources and surface insights without writing code or building queries manually.
- Automation services: Schedule report delivery, trigger snapshot captures on defined events, and set condition-based actions to keep teams updated without manual intervention.
- Data wrangling and transformation: Clean, prepare, and transform data from structured and unstructured sources directly within the platform before analysis.
Pros and Cons
Pros:
- Truly beautiful data visualizations
- Cloud and web deployment
- Easy to use and learn
Cons:
- No universal pricing model
- No version for Mac OS

IBM Cognos Analytics is an enterprise BI platform that combines self-service data modeling, AI-assisted reporting, interactive dashboards, and data visualization tools within a centralized, governed analytics environment.
Who Is IBM Cognos Analytics Best For?
IBM Cognos Analytics is a strong fit for enterprise data and analytics teams that need centralized governance alongside self-service reporting across large, complex data environments.
Why I Picked IBM Cognos Analytics
IBM Cognos Analytics earns its spot on my shortlist because of how well its web-based data modeling capabilities hold up in real enterprise environments. I particularly like the self-service modeling interface, where analysts can build and certify data models directly in the browser without handing work off to IT. Pair that with the AI Assistant, which lets you query those models in natural language and instantly generate dashboards, and your team can go from raw data to a shareable visualization in one session.
IBM Cognos Analytics Key Features
- Pixel-perfect report authoring: Build formatted, print-ready reports with drag-and-drop layout tools designed for precise data presentation.
- Predictive forecasting: Use built-in statistical models to generate time-series forecasts and trend analyses directly within your dashboards.
- Role-based access control: Assign data access permissions at the folder, report, or data source level to enforce governance across teams.
- Scheduled report delivery: Automate report distribution by scheduling exports to email, file systems, or shared locations on a recurring basis.
Pros and Cons
Pros:
- No need to understand SQL
- AI-generated visualization
- Mobile accessibility with web-based logins
Cons:
- Lag time when processing big data sets
- Integrating data sources is a little clunky

Oracle Business Intelligence is an enterprise BI suite that combines query, reporting, ad hoc analysis, dashboards, mobile analytics, OLAP, data mining, and financial performance management applications within a single, unified architecture.
Who Is Oracle Business Intelligence Best For?
Oracle Business Intelligence is a strong fit for large enterprises running Oracle infrastructure who need a unified platform for reporting, analytics, and financial planning.
Why I Picked Oracle Business Intelligence
Oracle Business Intelligence earns its spot as one of the best on my shortlist because it's one of the few platforms that genuinely covers the full performance management lifecycle in a single architecture. I particularly like Oracle BI Delivers, which monitors business activity in real time and triggers multi-step analytical workflows across users and applications. Combined with Oracle Real-Time Decisions, which blends rules-based logic with predictive analytics to surface recommendations inside live business processes, the platform goes well beyond standard reporting.
Oracle Business Intelligence Key Features
- Oracle BI Answers: A self-service ad hoc query tool that lets users build and run their own analyses against a shared semantic layer without writing SQL.
- Oracle BI Publisher: A formatted enterprise reporting tool for generating high-volume, pixel-perfect documents like invoices, regulatory filings, and operational reports.
- Interactive dashboards: Role-based dashboards that surface relevant KPIs, charts, and reports tailored to each user's function or access level.
- Oracle BI Server semantic layer: A centralized metadata repository that maps complex data sources into business-friendly terms, keeping metrics consistent across all reports.
Pros and Cons
Pros:
- Minimal training needed to get started
- User friendly interface and navigation
- Provides tutorials to guide you through the tools
Cons:
- Limited mobile capabilities
- Limited customization in reporting
Best for enterprise-grade self service to increase user autonomy

SAP BusinessObjects is an on-premises business intelligence suite that covers data reporting, visualization, ad hoc analytics, and enterprise-wide sharing of insights on a single, scalable platform.
Who Is SAP BusinessObjects Best For?
SAP BusinessObjects is a strong fit for large enterprises that need to scale BI access across thousands of users without sacrificing governance or data consistency.
Why SAP BusinessObjects Stands Out
SAP BusinessObjects stands out for how deeply it's built around enterprise-grade self-service. Web Intelligence lets business users build, modify, and share their own reports without routing every request through IT, which in large organizations changes how fast teams can act on data. I also like SAP Lumira for self-service data visualization, since it lets analysts explore data and build dashboards on their own terms. Together, these tools give non-technical users real autonomy without removing governance controls from the people who need them.
SAP BusinessObjects Key Features
- Crystal Reports: Build pixel-perfect, formatted operational and transactional reports designed for precise print and PDF output.
- Universe semantic layer: Map complex database structures to plain business terminology so analysts query data without needing SQL knowledge.
- Scheduling and publication: Automate report delivery to individuals or groups on a set schedule across multiple output formats.
- Mobile BI access: View dashboards and reports on mobile devices with an interface optimized for smaller screens.
Pros and Cons
Pros:
- Excel-based functionality is easy to use
- Robust training and online courses
- No need for technical data analysts
Cons:
- User interface is a little cumbersome
- Limited data transformation capabilities
Altre Piattaforme di Business Intelligence
Non potevo completare questa lista di piattaforme di analytics senza menzionare alcune altre opzioni. Scopri queste soluzioni aggiuntive per vedere se una di esse soddisfa meglio le tue esigenze rispetto a quelle dell’elenco principale.
- QlikView
For accessing Qlik Sense to leverage AI data exploration
- SAS Business Intelligence
For automated insights that prioritize context
- Microsoft Power BI
For creating rich data visualizations
- Pentaho
For scaling to enterprise-grade data management
- Yellowfin BI
For automated analysis and storytelling
- Compass
For ensuring a better developer experience
- Sisense
For using analytics tools to enhance your final product without any coding
- Klipfolio
Business intelligence tool for self-service analytics and reporting
- Domo
For intuitive dashboards and reporting tools that democratize your data
- Mopinion
All-in-one business intelligence software for digital channels


Recensioni Correlate di Piattaforme di Business Intelligence
Se qui non hai ancora trovato quello che cerchi, dai un'occhiata a questi strumenti strettamente legati alle piattaforme di business intelligence che abbiamo testato e valutato.
- Software per le Vendite
- Software di Lead Management
- Software di Business Intelligence
- Software di Gestione Contratti
- Sistema di Gestione delle Entrate
- Software CPQ
Criteri di Selezione per la Piattaforma di Business Intelligence
La selezione della piattaforma di business intelligence ideale comporta una valutazione approfondita delle sue funzionalità, assicurandosi che siano perfettamente allineate alle specifiche esigenze aziendali e alla gestione delle revenue operation. Basandomi sulla mia esperienza e su un'estesa ricerca, ho sviluppato una serie di criteri per valutare queste piattaforme in modo completo.
Funzionalità Base delle Piattaforme di Business Intelligence: 25% del punteggio totale
Per essere inclusa nella mia lista delle migliori piattaforme BI, la soluzione doveva supportare la possibilità di soddisfare i casi d'uso più comuni:
- Semplificazione dell'elaborazione e dell'integrazione dei dati
- Miglioramento della visualizzazione dei dati e della reportistica
- Fornitura di soluzioni di archiviazione dati scalabili e sicure
- Facilitazione di analisi predittive e prescrittive
- Supporto al processo decisionale grazie all'accesso ai dati in tempo reale
Caratteristiche Distintive Aggiuntive: 25% del punteggio totale
- Integrazione di intelligenza artificiale e machine learning per analisi avanzate dei dati
- Opzioni eccezionali di personalizzazione per dashboard e report
- Capacità di integrazione superiori con nuovi strumenti e piattaforme di mercato
- Funzionalità di sicurezza all'avanguardia per garantire l'integrità dei dati
- Funzionalità innovative di collaborazione per analisi basate sul lavoro di squadra
Usabilità: 10% del punteggio totale
- Equilibrio tra funzionalità avanzate e interfaccia intuitiva
- Navigazione semplificata e layout intuitivo
- Accessibilità su dispositivi e piattaforme diversi
Onboarding: 10% del punteggio totale
- Materiale formativo completo come video tutorial e guide per l'utente
- Processi di configurazione e implementazione rapidi
- Assistenza interattiva tramite chatbot e supporto in tempo reale
Assistenza Clienti: 10% del punteggio totale
- Disponibilità di molteplici canali di supporto
- Reattività ed efficacia del team di supporto
- Servizio clienti proattivo e supporto continuo
Rapporto Qualità-Prezzo: 10% del punteggio totale
- Prezzi competitivi con chiara distinzione tra i livelli di funzionalità
- Flessibilità nei piani tariffari per adattarsi a varie dimensioni aziendali
- Analisi trasparente di costi e benefici
Recensioni dei Clienti: 10% del punteggio totale
- Feedback positivo su funzionalità e facilità d'uso
- Critiche riguardo le aree di miglioramento e come vengono affrontate
- Testimonianze dei clienti che evidenziano benefici specifici
Questi criteri garantiscono che la piattaforma di business intelligence selezionata non solo soddisfi i requisiti fondamentali ma offra anche caratteristiche uniche che portano valore significativo alle aziende, migliorando la loro capacità di gestire e ottimizzare efficacemente le operazioni di revenue.
Come scegliere le piattaforme di Business Intelligence
Con così tante piattaforme di business intelligence disponibili, può essere difficile decidere quale strumento sia il più adatto alle tue esigenze.
Quando selezioni, valuti e provi una piattaforma di business intelligence, considera i seguenti aspetti:
- Quale problema vuoi risolvere - Inizia individuando la carenza di funzionalità che vuoi colmare per chiarire quali funzionalità la piattaforma deve offrire.
- Chi avrà bisogno di usarla - Per valutare costi e necessità, considera chi utilizzerà il software e di quante licenze avrai bisogno. Dovrai valutare se sarà solo per i responsabili delle revenue operation o per tutta l'organizzazione. Una volta chiarito questo punto, valuta se dare priorità alla facilità d'uso per tutti o alla velocità per gli utenti avanzati della piattaforma di business intelligence.
- Con quali altri strumenti deve funzionare - Chiarisci quali strumenti stai sostituendo, quali rimarranno e con quali dovrai integrare, come software di contabilità, CRM o gestione delle risorse umane. Devi decidere se gli strumenti dovranno integrarsi tra loro o se puoi sostituirne diversi con un'unica piattaforma di business intelligence consolidata.
- Quali risultati sono importanti - Considera i risultati che il software deve raggiungere per essere considerato un successo. Rifletti su quale capacità vuoi acquisire o migliorare e su come misurerai questo successo. Ad esempio, un risultato potrebbe essere ottenere una maggiore visibilità sulle performance. Potresti confrontare tutte le funzionalità delle piattaforme di business intelligence, ma se non pensi ai risultati che vuoi ottenere, rischi di sprecare molto tempo prezioso.
- Come funzionerebbe all'interno della tua organizzazione - Valuta la scelta del software nel contesto dei tuoi processi e metodi di lavoro. Analizza ciò che funziona bene e le aree problematiche da affrontare. Ricorda che ogni azienda è diversa: non dare per scontato che uno strumento funzionerà per te solo perché è molto diffuso.
Tendenze nelle Piattaforme di Business Intelligence per 2026
La rapida evoluzione delle piattaforme di business intelligence riflette una tendenza più ampia verso il potenziamento delle capacità analitiche e l'ottimizzazione delle operazioni di ricavo nelle aziende di tutte le dimensioni. Esploriamo gli sviluppi più significativi:
Tendenze principali ed evoluzioni
- Integrazione con tecnologie emergenti: Le piattaforme integrano sempre più spesso l'intelligenza artificiale e il machine learning per automatizzare l'analisi dei dati e offrire insight più approfonditi.
- Elaborazione dei dati in tempo reale: Si assiste a una transizione verso l'analisi in tempo reale per aiutare le aziende a reagire più rapidamente ai cambiamenti del mercato.
Funzionalità innovative e insolite
- Analisi predittiva: L'utilizzo di modelli predittivi avanzati per prevedere tendenze e comportamenti sta diventando sempre più comune, fornendo alle aziende uno strumento proattivo per anticipare le sfide future.
- Analisi aumentata: Gli strumenti integrano la realtà aumentata per visualizzare i dati in modi nuovi, rendendo le informazioni complesse più accessibili e comprensibili.
Funzionalità più importanti e richieste
- Strumenti di visualizzazione dei dati: Questi restano fondamentali, con miglioramenti che permettono dashboard più personalizzabili e interattive.
- Funzionalità collaborative: Con la diffusione del lavoro remoto, le piattaforme BI stanno potenziando le caratteristiche che favoriscono la collaborazione tra team e aree geografiche diverse.
Funzionalità in calo
- Reportistica statica: La richiesta di report tradizionali statici sta diminuendo a favore di sistemi di reportistica dinamici e interattivi che offrono agli utenti insight più approfonditi.
Queste tendenze dimostrano una trasformazione significativa nel settore della business intelligence, guidata dall'esigenza di adattarsi a un ambiente imprenditoriale veloce e guidato dai dati. Per i responsabili delle operations di ricavo, scegliere una piattaforma BI in linea con queste tendenze è fondamentale per mantenere un vantaggio competitivo.
Cosa sono le piattaforme di Business Intelligence?
Le piattaforme di business intelligence sono soluzioni tecnologiche che facilitano un'analisi dati completa per le aziende. Queste piattaforme integrano, elaborano e analizzano dati provenienti da diverse fonti, presentandoli in un formato accessibile e utilizzabile attraverso report, dashboard e visualizzazioni. Servono come sistemi centralizzati per insight basati sui dati, soddisfacendo le diverse esigenze informative all'interno di un'organizzazione, dalle metriche operative alle decisioni strategiche.
I vantaggi delle piattaforme di business intelligence includono la possibilità di prendere decisioni informate grazie a insight guidati dai dati. Aiutano a comprendere le tendenze di mercato, il comportamento dei clienti e i processi aziendali interni, portando a un miglioramento della pianificazione strategica e dell'efficienza operativa. Queste piattaforme offrono un vantaggio competitivo grazie a un'analisi più approfondita delle prestazioni aziendali e delle dinamiche di mercato. Inoltre, supportano la scalabilità adattandosi alle crescenti ed evolutive esigenze di dati di un'azienda e facilitano la gestione del rischio identificando potenziali problematiche e opportunità.
Funzionalità delle Piattaforme di Business Intelligence
Scegliere una piattaforma di business intelligence per la gestione delle operations di ricavo richiede la comprensione delle caratteristiche chiave che guidano efficienza e insight. Ecco le funzionalità più critiche da ricercare:
- Analisi in tempo reale: Fornisce informazioni immediate sulle prestazioni aziendali.
- Essenziale per prendere decisioni tempestive che possono avere un impatto significativo sulla crescita dei ricavi.
- Visualizzazione dei dati: Trasforma set di dati complessi in grafici comprensibili.
- Cruciale per comunicare rapidamente ed efficacemente le informazioni approfondite in tutta l’organizzazione.
- Analisi predittiva: Utilizza dati storici per prevedere le tendenze future.
- Aiuta ad anticipare i cambiamenti del mercato e ad adeguare le strategie di conseguenza.
- Integrazione dei dati: Combina dati da varie fonti in un’unica piattaforma coesa.
- Vitale per avere una visione olistica delle operazioni aziendali e delle interazioni con i clienti.
- Dashboard personalizzabili: Permette agli utenti di adattare le interfacce alle loro specifiche esigenze.
- Aumenta il coinvolgimento degli utenti e la produttività concentrandosi sui parametri chiave.
- Strumenti di collaborazione: Facilita la condivisione di informazioni e report tra i team.
- Sostiene una strategia coesa e l’allineamento tra diversi reparti.
- Scalabilità: Si adatta al crescente volume di dati e alle esigenze di business in evoluzione.
- Garantisce che la piattaforma continui ad essere utile man mano che l’azienda cresce.
- Gestione degli accessi utente: Controlla chi può visualizzare e manipolare i dati.
- Importante per mantenere la sicurezza e l’integrità dei dati.
- Accessibilità mobile: Fornisce accesso a dati e informazioni anche in movimento.
- Aumenta la flessibilità e la reattività dei team.
Queste funzionalità garantiscono collettivamente che una piattaforma di business intelligence possa supportare ed ottimizzare efficacemente le operazioni finanziarie fornendo analisi approfondite, facilitando la comunicazione e assicurando processi decisionali basati sui dati.
Vantaggi delle piattaforme di business intelligence
Le piattaforme di business intelligence offrono strumenti essenziali alle organizzazioni che desiderano migliorare la gestione delle operazioni di revenue. Ecco cinque vantaggi chiave:
- Miglioramento del processo decisionale: Fornisce informazioni operative per scelte più consapevoli.
- Facilita la pianificazione strategica fornendo dati precisi e aggiornati.
- Aumento dell’efficienza operativa: Automatizza i processi di analisi dei dati.
- Riduce le attività manuali e consente ai team di concentrarsi su attività strategiche.
- Migliore qualità e accuratezza dei dati: Centralizza la gestione dei dati.
- Aiuta a mantenere dati coerenti e privi di errori in tutta l’organizzazione.
- Report personalizzabili: Offre report su misura per soddisfare specifiche esigenze aziendali.
- Permette agli utenti di visualizzare i dati nei formati più adatti ai loro obiettivi operativi.
- Scalabilità: Si adatta alle crescenti esigenze di dati e all’espansione aziendale.
- Sostiene la crescita del business senza la necessità di cambi frequenti del software.
Costi e prezzi delle piattaforme di business intelligence
Scegliere la piattaforma di business intelligence più adatta richiede la comprensione dei vari piani tariffari pensati per soddisfare diverse esigenze e budget aziendali. Ecco una panoramica delle opzioni tipiche disponibili:
| Tipo di piano | Prezzo medio | Funzionalità comuni |
|---|---|---|
| Base | $10 - $30 per utente/mese | Analisi di base, visualizzazione dei dati, dashboard limitate |
| Professional | $50 - $100 per utente/mese | Analisi avanzate, più integrazioni, report personalizzati |
| Enterprise | Prezzo personalizzato | Accesso completo alle funzionalità, sicurezza avanzata, supporto dedicato |
| Gratuito | $0 | Accesso alle funzionalità di base, capacità dati limitata |
Quando scegli un piano, considera non solo il costo ma anche quanto le funzionalità siano in linea con la dimensione e le necessità della tua azienda. Un piano che si adatta in modo appropriato alla tua crescita e fornisce capacità analitiche essenziali senza troppo gravare sul budget è l’ideale.
Domande Frequenti sulle Piattaforme di Business Intelligence
C’è ancora molto da imparare sugli strumenti di business intelligence, quindi che altre domande hai? Ecco alcune risposte alle preoccupazioni più comuni per iniziare.
Chi utilizza le piattaforme di business intelligence?
Gli strumenti di business intelligence sono utili praticamente in ogni settore, ma l’adozione è più rapida in alcuni verticali come sanità, finanza e intrattenimento. Alcuni reparti della tua organizzazione che potrebbero trarre maggior beneficio da queste piattaforme includono:
- Vendite: Questo team può ottenere nuovi insight sulle tendenze di mercato per garantire strategie di vendita migliori.
- Analisti: Possono utilizzare questi strumenti per comprendere meglio le tendenze di mercato e il comportamento dei clienti.
- Marketing: Possono usare la BI per analizzare l’efficacia delle campagne e ottimizzarle al meglio.
- Team IT: I tuoi team tecnici possono sfruttare la BI per elaborare grandi set di dati e generare report.
Quali sono 5 sistemi per la business intelligence?
Esistono molti tipi di business intelligence e generalmente il software di BI combina alcuni o tutti questi strumenti in un’unica piattaforma. Alcuni tra gli strumenti più comuni che troverai includono:
- Fogli di calcolo: Ampiamente usati per chi preferisce le analisi manuali, come Google Sheets e Microsoft Excel.
- Visualizzazioni dei dati: Dai grafici alle tabelle, le visualizzazioni sono sistemi BI che rendono i dati più leggibili.
- Strumenti di data mining: Trovare e organizzare grandi quantità di dati non è semplice, quindi queste piattaforme usano machine learning e intelligenza artificiale per facilitare il processo.
- Software di reportistica: Questo sistema riporta, filtra, organizza e mostra i dati in modo da ricavare insight più rapidamente.
- Online analytical processing: Conosciuti anche come OLAP, puoi utilizzare questi strumenti per analizzare set di dati da diverse prospettive a seconda delle particolari esigenze aziendali.
Le piattaforme di business intelligence possono prevedere le tendenze di mercato?
Sì, molte piattaforme di business intelligence sono dotate di capacità di analisi predittiva che analizzano i dati storici e le attuali condizioni di mercato per prevedere le tendenze future. Questi strumenti utilizzano algoritmi e machine learning per fornire insight che aiutano le aziende ad anticipare i movimenti di mercato e adeguare di conseguenza le proprie strategie.
Quali opzioni di assistenza clienti sono offerte dalle piattaforme di business intelligence?
Le piattaforme di business intelligence offrono solitamente una gamma di opzioni di supporto clienti tra cui portali di assistenza online, chat dal vivo, email e supporto telefonico. Alcuni fornitori offrono anche account manager dedicati e supporto 24/7 per problemi critici, garantendo che le aziende possano ricevere assistenza ogni volta che ne hanno bisogno.
Come gestiscono le piattaforme di business intelligence grandi set di dati?
Le piattaforme di business intelligence sono progettate per gestire grandi set di dati in modo efficiente. Utilizzano tecnologie come data warehousing, elaborazione in-memory e compressione dei dati per migliorare il recupero delle informazioni e le prestazioni. Le piattaforme più avanzate offrono anche strumenti di data governance per assicurare la qualità e la coerenza dei dati su dataset estesi.
Altri Software per RevOps
Esistono molti altri strumenti che potresti avere bisogno di aggiungere per completare il tuo stack tecnologico. Dai un’occhiata alle mie panoramiche su queste altre soluzioni per trovare la combinazione giusta per le esigenze della tua azienda:
- Strumenti Cloud BI
- Software di Analisi delle Vendite
- Piattaforme di Revenue Intelligence
- Software di Sales Intelligence
- Software di Analitica Predittiva
- Software per lo Sviluppo del Business
- Software di Previsione delle Vendite
Conclusione
Potresti sentirti sopraffatto da tutte le informazioni che ti ho appena fornito, ma dovrebbe essere semplice restringere le tue preferenze principali dalla mia lista. Iscriviti alle prove gratuite e alle demo per vedere come questi strumenti funzionano realmente e restringi ulteriormente le tue scelte. Sono certo che riuscirai a trovare lo strumento giusto per le tue esigenze.
E se vuoi rimanere aggiornato sulle ultime tendenze nel mondo dei revops, iscriviti alla newsletter per ricevere ogni settimana approfondimenti dagli esperti!