

I 10 migliori software di business intelligence per le operazioni sui ricavi nel 2026

10 Elenco dei migliori software di business intelligence


In qualità di manager RevOps, scegliere il software di business intelligence giusto può essere un compito scoraggiante. Questo articolo presenta le 20 migliori opzioni disponibili nel 2026, offrendo informazioni sulle loro funzionalità e sui loro vantaggi per semplificare le operazioni e aumentare i ricavi.
Perché fidarsi dei nostri consigli sui software
Le nostre recensioni riflettono il nostro giudizio indipendente, non un discorso di vendita. Scopri come manteniamo la trasparenza.
Per questa guida, abbiamo valutato gli strumenti attraverso test pratici e ricerche indipendenti, assegnando un punteggio agli strumenti in base ai nostri criteri di selezione.
Le nostre recensioni riflettono il nostro giudizio editoriale umano, non un discorso di vendita.
Riepilogo dei migliori software di business intelligence
| Tool | Best For | Trial Info | Price | ||
|---|---|---|---|---|---|
| 1 | Ideale per piattaforma di analisi dati unificata | Prova gratuita di 14 giorni disponibile | Prezzo su richiesta | Website | |
| 2 | Il miglior software di business intelligence per team RevOps alle prime armi | Prova gratuita di 15 giorni + demo gratuita disponibile | A partire da $24/mese | Website | |
| 3 | Miglior software di business intelligence per analytics incorporata | Demo gratuita disponibile | Prezzi su richiesta | Website | |
| 4 | Ideale per una governance dei dati coerente | Piano gratuito disponibile | Da $9/utente/progetto/mese | Website | |
| 5 | Miglior software di business intelligence per la modellazione di dati low-code | Prova gratuita + demo gratuita disponibili | Prezzo su richiesta | Website | |
| 6 | Il miglior software di business intelligence per la visualizzazione dinamica dei dati | Demo gratuita disponibile | Prezzo su richiesta | Website | |
| 7 | La migliore soluzione di business intelligence per la creazione autonoma di report | Not available | Contatta per un preventivo. | Website | |
| 8 | Il miglior software di business intelligence per analytics self-service | Demo gratuita disponibile | Prezzo su richiesta | Website | |
| 9 | Ideale per l'integrazione di analytics embedded | Demo gratuita | Prezzo su richiesta | Website | |
| 10 | Il miglior software di business intelligence per insight guidati dall'intelligenza artificiale | Prova gratuita di 30 giorni + demo gratuita | Da $10 utente/mese | Website |

Recensioni dei migliori software di business intelligence
Ecco una breve descrizione di ciascun software di business intelligence, che illustra il caso d’uso migliore di ogni sistema, le funzionalità più importanti, i pro & contro, l’interfaccia utente e le informazioni sui prezzi.
Ideale per piattaforma di analisi dati unificata
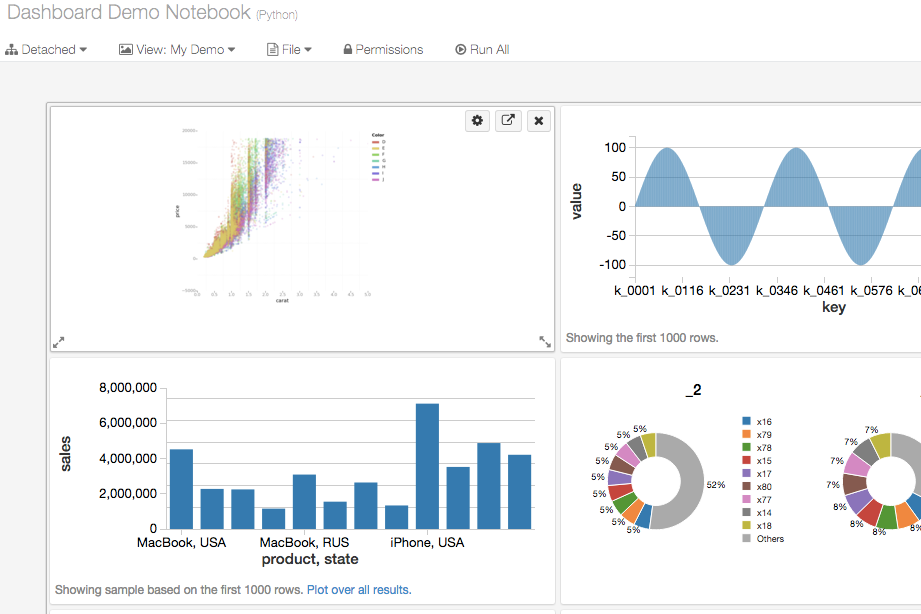
Databricks è una piattaforma di analisi cloud-nativa che unifica data warehousing, machine learning e BI alimentata dall'AI in un unico ambiente scalabile per team di dati e team di revenue.
Per chi è ideale Databricks?
Databricks è particolarmente adatto alle aziende mature nell'ambito dei dati con esigenze di infrastruttura dati su larga scala e team dedicati di data engineering o analytics engineering.
Perché ho scelto Databricks
Ho scelto Databricks come una delle migliori piattaforme perché nessun'altra riduce il divario tra dati grezzi e insight sui ricavi come questa. L'architettura lakehouse significa che il mio team non deve trasferire dati tra un data warehouse, uno strumento BI e un ambiente ML separato. Il livello semantico di Unity Catalog garantisce una definizione unica delle metriche come pipeline o ARR su dashboard, agenti AI e strumenti a valle. Inoltre, Genie consente agli stakeholder di revenue, anche non tecnici, di interrogare i dati in linguaggio naturale, senza dover aspettare che un data analyst costruisca un nuovo report.
Funzionalità principali di Databricks
- Dashboard AI/BI: Un builder di dashboard nativo drag-and-drop che permette al team di creare e pubblicare visualizzazioni interattive direttamente sui dati del lakehouse.
- SQL Serverless: Calcolo SQL on-demand che si adatta automaticamente, così gli analisti di revenue possono eseguire query ad hoc senza gestire o configurare infrastrutture.
- Analisi predittiva via SQL: Funzioni integrate che consentono agli analisti di richiamare modelli ML e GenAI direttamente dalle query SQL per generare previsioni e risultati valutati.
- Layer di storage Delta Lake: Un formato di storage transazionale open-source che garantisce affidabilità, versionamento e coerenza dei dati per tutti i carichi analitici.
Integrazioni Databricks
Databricks offre decine di integrazioni validate tramite Partner Connect, che coprono categorie come ingestione dati, BI, trasformazione dati, reverse ETL e governance. Tra le integrazioni Partner Connect degne di nota ci sono Fivetran, Informatica, dbt Cloud, Power BI, Tableau, Qlik Sense, Sigma Computing, ThoughtSpot, Hightouch e Census. Databricks fornisce anche integrazioni con strumenti ETL/ELT come Prophecy e Azure Data Factory, strumenti di orchestrazione come Airflow e strumenti per database SQL come DataGrip e DBeaver. È disponibile su Zapier e offre una REST API per integrazioni personalizzate.
Pros and Cons
Pros:
- Unifica carichi di lavoro di engineering, analytics e ML
- Acquisisce dati CRM in una vista unica del cliente
- Supporta nativamente quasi ogni formato di dati grezzi
Cons:
- Richiede conoscenze di Python, SQL o Scala
- La gestione errata dei cluster può incrementare rapidamente i costi

Il miglior software di business intelligence per team RevOps alle prime armi
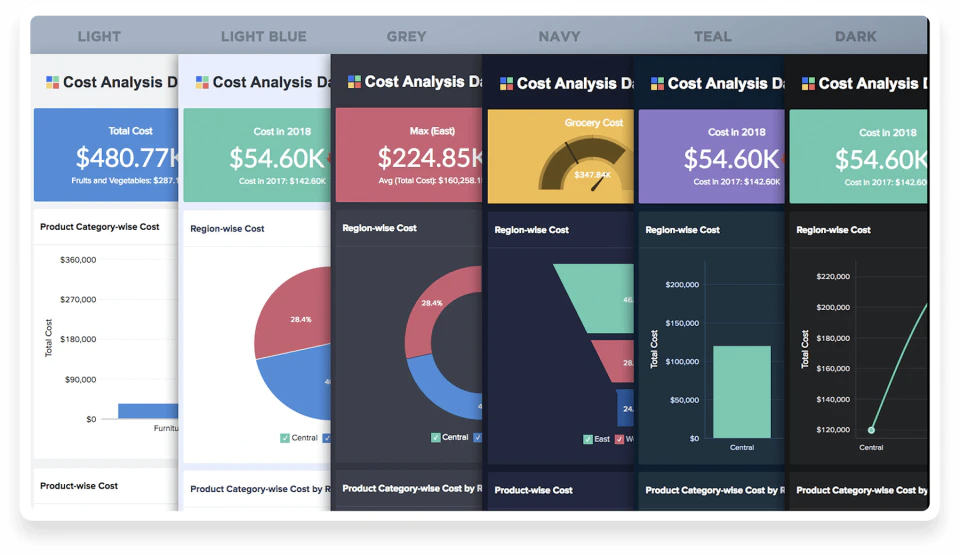
Zoho Analytics è uno strumento di business intelligence che aiuta i team RevOps alle prime armi a sfruttare i dati nelle decisioni aziendali. La fascia di prezzo del software lo rende accessibile ai piccoli team RevOps che stanno appena iniziando.
Perché ho scelto Zoho Analytics: Zoho Analytics è facile da usare e intuitivo anche per chi ha poca o nessuna esperienza con i dati o competenze tecniche. Il software ha un layout pulito e la sua interfaccia drag-and-drop consente di personalizzare dashboard e report senza difficoltà.
Zoho Analytics importa dati da più fonti, così puoi analizzare tutti i dati aziendali da un'unica posizione centrale. Le dashboard interattive ti permettono di suddividere e interpretare i dati così da ottenere informazioni utili e attuabili.
Caratteristiche e integrazioni distintive di Zoho Analytics:
Caratteristiche includono automazione dei report, analytics aumentati, analytics predittivi, approfondimenti contestuali, visualizzazioni interattive, assistente di intelligenza artificiale, report generati automaticamente e avvisi sui dati.
Integrazioni includono tutti gli strumenti Zoho, oltre a HubSpot, Quickbooks Online, Sage, Salesforce, Shopify, Stripe, Xero e altre soluzioni software.
Pros and Cons
Pros:
- Ottimo per chi utilizza già altre soluzioni Zoho
- Conveniente
- Include un assistente AI
Cons:
- Non è possibile condividere i report direttamente su uno storage cloud
- La sincronizzazione dei dati avviene a intervalli prestabiliti, quindi non traccia i dati in tempo reale
New Product Updates from Zoho Analytics

Zoho Analytics Adds Exogenous Variables to Multivariate Forecasting
Zoho Analytics introduces exogenous variables for multivariate forecasting using the VARX model. This helps forecasts account for external drivers such as marketing spend, discounts, and seasonality. For more information, visit Zoho Analytics’ official site.
 .
.
Toucan
Miglior software di business intelligence per analytics incorporata
Perché ho scelto Toucan
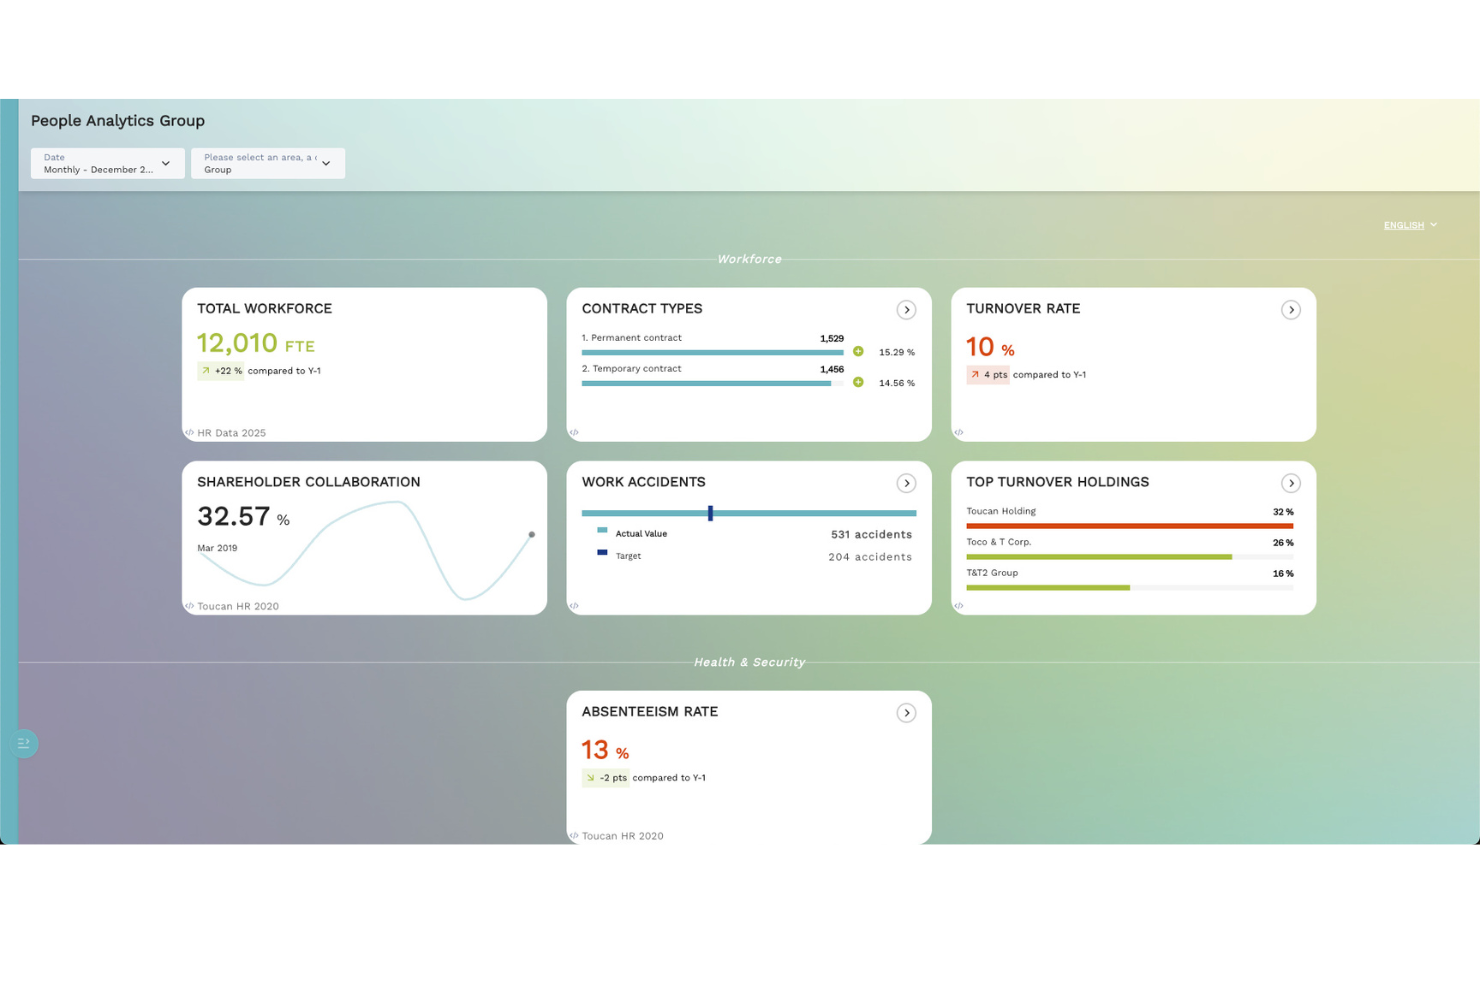
Ho scelto Toucan perché si specializza nell’integrare l’analisi dei dati nelle applicazioni di uso quotidiano, permettendo ai team di prodotto o agli utenti finali di accedere agli insight direttamente dove lavorano, senza dover aprire uno strumento BI separato. La creazione di dashboard senza codice lo rende accessibile anche ai team che non sono esperti sviluppatori BI. Questo aiuta le organizzazioni a far emergere insight in tempo reale nei flussi di lavoro attigui, riducendo la frizione e incentivando l’adozione.
Caratteristiche principali di Toucan
- Creazione di dashboard senza codice: Consente agli utenti non tecnici di creare e distribuire dashboard.
- Supporto per analytics incorporata: Permette di posizionare visualizzazioni BI all’interno di app o portali esistenti.
- Feed dati in tempo reale: Mantiene i dati delle analytics incorporate sempre aggiornati.
- Storytelling e livello narrativo: Aggiunge contesto e spiegazioni ai dashboard.
Integrazioni di Toucan
Le integrazioni includono strumenti come Snowflake, BigQuery, MySQL, endpoint REST, Google Sheets, Salesforce, Slack e SDK incorporabili per l’integrazione di prodotto.
Pros and Cons
Pros:
- La piattaforma senza codice di Toucan semplifica l’integrazione degli analytics incorporati per gli utenti non tecnici.
- Il software offre visualizzazioni in tempo reale e strumenti di storytelling che migliorano il processo decisionale.
- Supporta un’ampia gamma di connettori dati per un’integrazione senza soluzione di continuità con le principali fonti dati.
Cons:
- Gli utenti segnalano rallentamenti nelle prestazioni quando si gestiscono grandi set di dati.
- Alcuni trovano le opzioni di personalizzazione limitate rispetto ad altri strumenti BI.

Looker
Ideale per una governance dei dati coerente
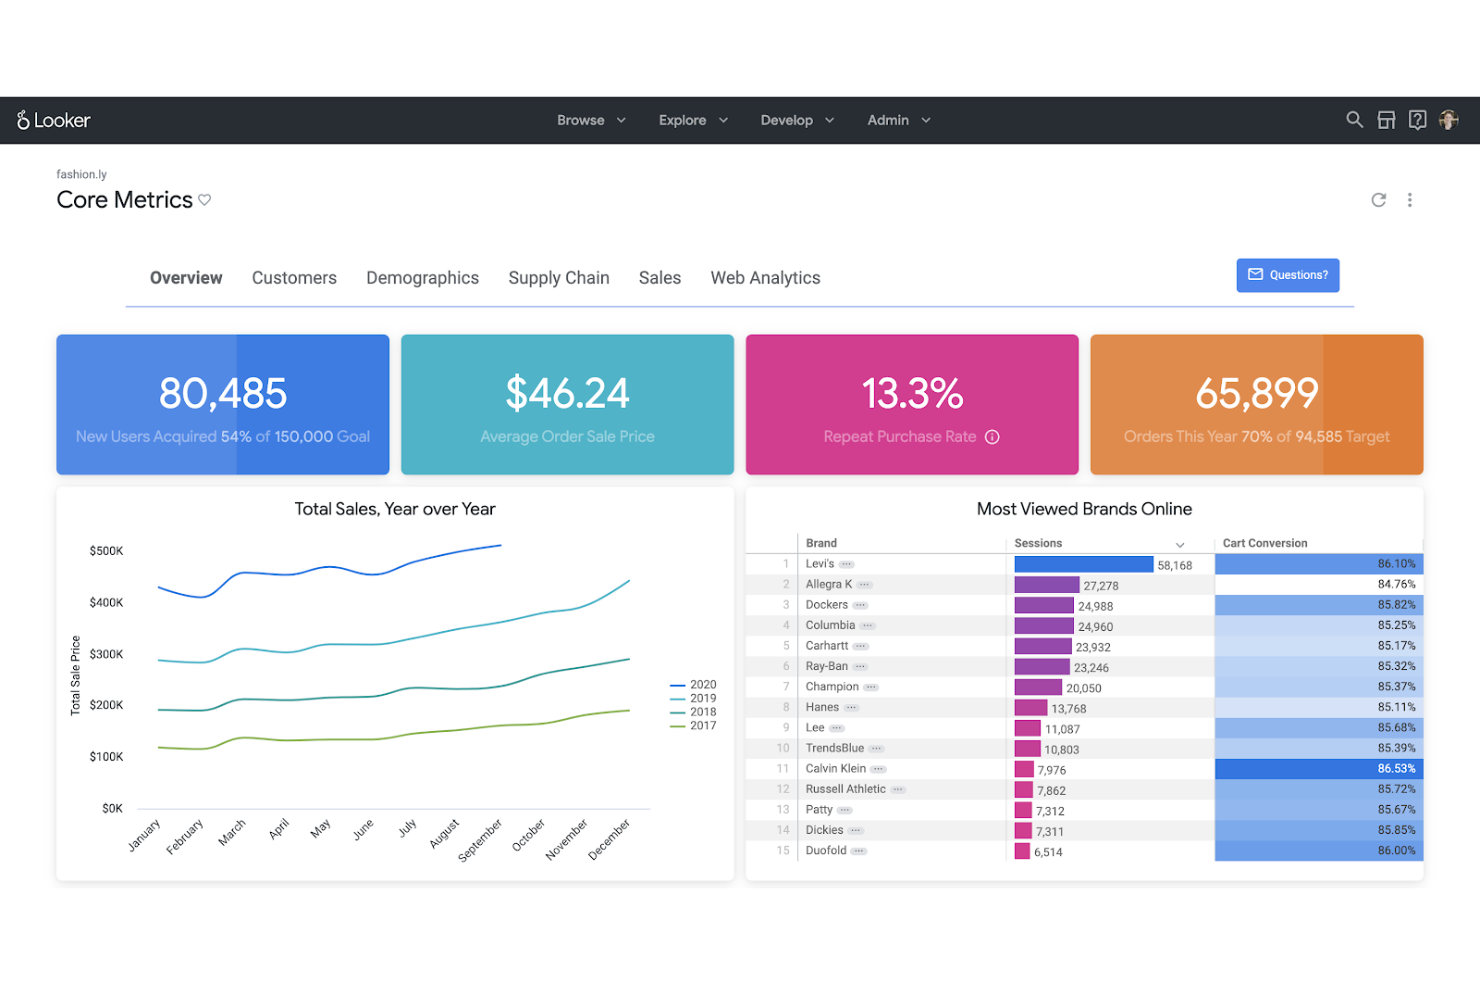
Looker è una piattaforma di business intelligence che trasforma dati grezzi in insight azionabili per i team aziendali. Combina analisi in tempo reale, modellazione semantica e reportistica basata sull'IA per aiutare le organizzazioni a governare, esplorare e monetizzare i dati su larga scala. Costruita su Google Cloud, Looker supporta analisi incorporate e connettività multi-cloud, aiutando i team ad accelerare il processo decisionale basato sui dati in tutte le funzioni aziendali.
Perché ho scelto Looker: Ho scelto Looker per il suo strato di modellazione semantica universale, che garantisce una governance dei dati coerente e metriche affidabili per tutta l'organizzazione. L'integrazione con Google Cloud ne aumenta la scalabilità e la sicurezza, offrendo al contempo accesso immediato a strumenti di analisi come BigQuery e Google Workspace. L'analisi potenziata dall'IA e l'interfaccia intuitiva di Looker lo rendono ideale per i leader che desiderano una visibilità approfondita senza sacrificare agilità o controllo.
Funzionalità e integrazioni principali:
Le funzionalità includono analisi potenziate dall'IA, un linguaggio di modellazione basato su SQL (LookML), analisi integrate per esperienze dati personalizzate e dashboard interattive in tempo reale che migliorano la visibilità tra i team.
Le integrazioni includono Google BigQuery, Amazon Redshift, Snowflake, Microsoft SQL Server, PostgreSQL, MySQL, Oracle, Google Sheets, Google Analytics e Salesforce.
Pros and Cons
Pros:
- Looker offre capacità avanzate di modellazione SQL che migliorano la gestione dei dati per le organizzazioni che già conoscono SQL.
- La piattaforma supporta un'ampia varietà di fonti dati, tra cui Google BigQuery e Spark, offrendo versatilità per grandi installazioni di dati.
- Looker si integra bene con i prodotti Google, permettendo un'analisi e una reportistica dei dati senza interruzioni.
Cons:
- Il prezzo elevato di Looker, che parte da $5.000 al mese per 10 utenti, potrebbe non essere adatto a piccoli team.
- La piattaforma richiede almeno un esperto SQL per un uso efficace, il che può rappresentare una barriera per alcune organizzazioni.
Domo
Miglior software di business intelligence per la modellazione di dati low-code
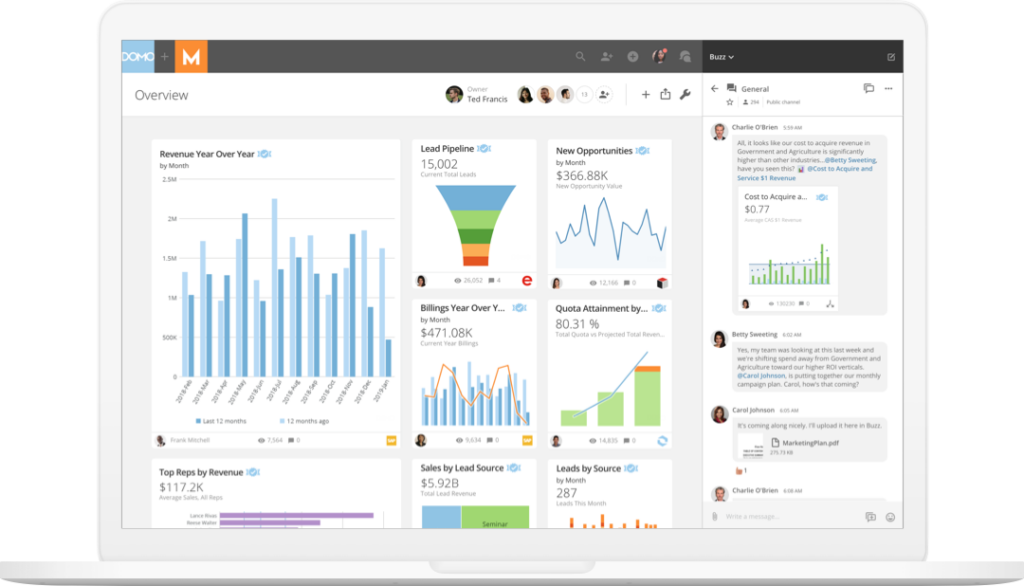
Domo Business Cloud è una piattaforma di business intelligence e analisi low-code che aiuta i team di revenue a creare app personalizzate per l'analisi dei dati.
Perché ho scelto Domo Business Cloud: Domo Business Cloud consente di riunire molteplici fonti di dati, combinarne i risultati e interpretare le informazioni come parte di un insieme coerente. Il software permette di personalizzare la dashboard, così puoi visualizzare e modellare i dati provenienti da varie fonti contemporaneamente senza scrivere codice.
Domo Business Cloud offre una knowledge base completa, quindi gli specialisti RevOps dovrebbero essere in grado di utilizzare la maggior parte delle funzionalità dopo un breve periodo di onboarding.
Funzionalità e integrazioni principali di Domo Business Cloud:
Funzionalità includono machine learning, visualizzazione dei dataset, un portale self-service, un'app mobile, scoperta automatica dei dati, avvisi e notifiche, grafici interattivi e un kit di strumenti per il branding.
Integrazioni includono Amazon Advertising, Facebook, FreshService, Google Analytics, LinkedIn, Qualtrics, Salesforce, Twitter, WordPress, Zoom e altre opzioni software.
Pros and Cons
Pros:
- Dashboard facili da personalizzare
- Ottima app mobile
- Le notifiche automatiche aiutano a prendere decisioni tempestive
Cons:
- Alcuni connettori non sono semplici da usare
- Il software può diventare temporaneamente non reattivo quando elabora grandi quantità di dati
Grow
Il miglior software di business intelligence per la visualizzazione dinamica dei dati
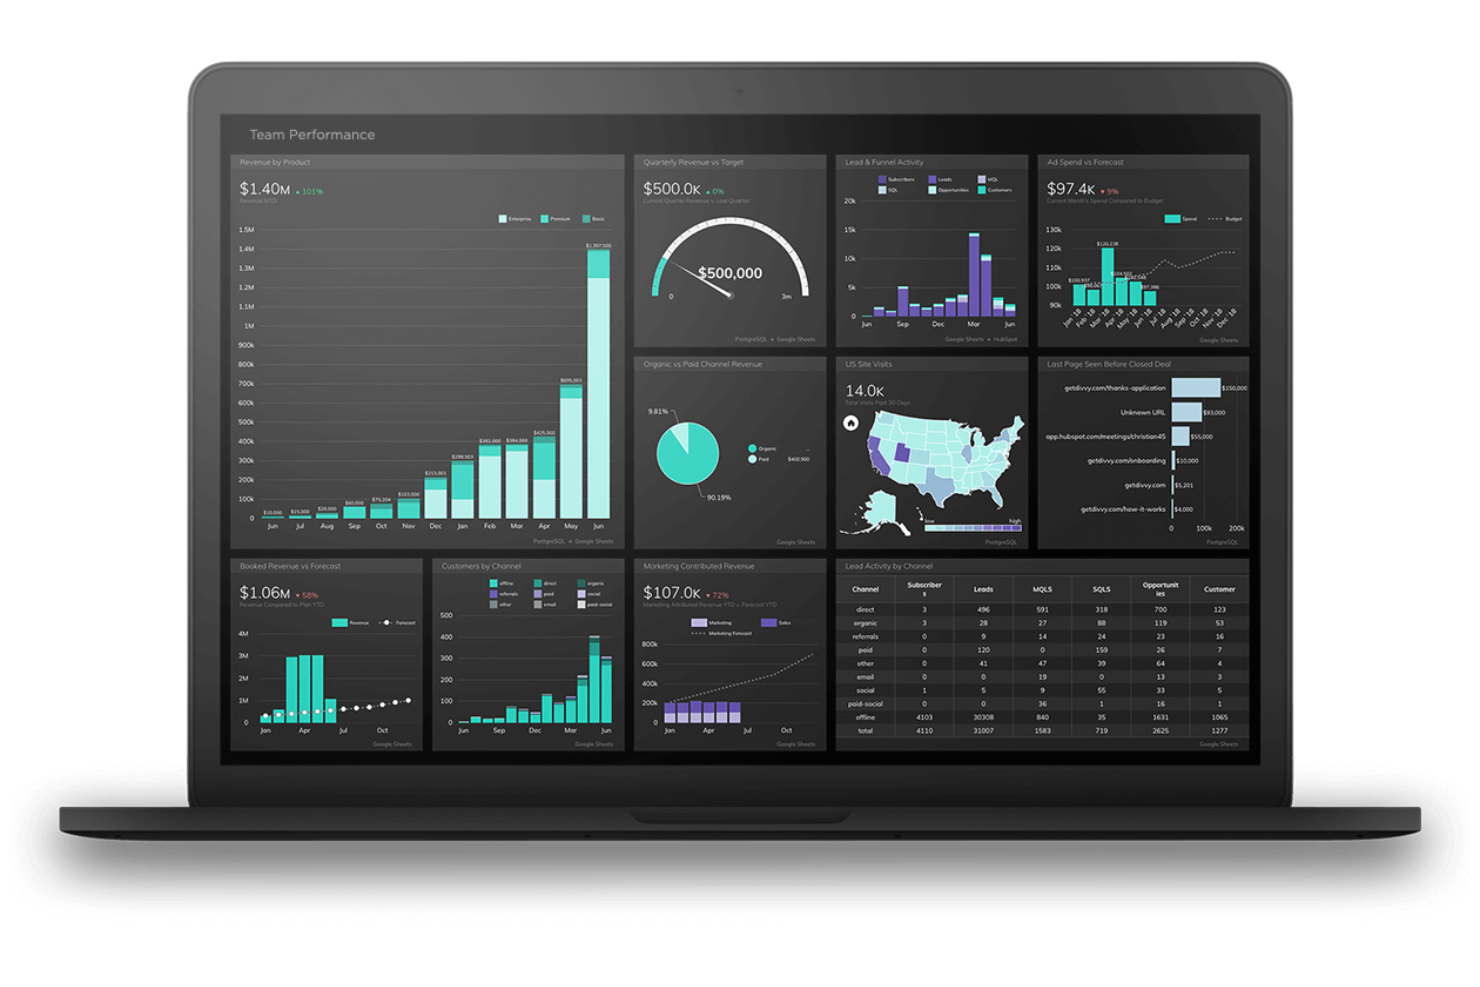
Grow.com è una piattaforma di business intelligence che semplifica l'integrazione, la visualizzazione e la collaborazione sui dati per le organizzazioni in crescita. Consolida i dati da oltre 150 fonti—da CRM e piattaforme pubblicitarie a sistemi finanziari—aiutando i team a trasformare dati frammentati in informazioni utili che guidano le prestazioni e la crescita.
Perché ho scelto Grow.com: Grow si distingue per la sua accessibilità e profondità. L'interfaccia no-code consente sia agli analisti sia agli utenti business di creare dashboard e report senza pesare sull’IT—ideale per i leader RevOps che cercano una rapida visibilità sui KPI di marketing, vendite e finanza. Le sue flessibili funzionalità ETL e il supporto per SQL/non-SQL la rendono adatta sia a preparazioni dati leggere che a modellazioni più avanzate.
Caratteristiche e integrazioni principali:
Le funzionalità includono dashboard dinamiche e personalizzabili, strumenti ETL drag-and-drop e reportistica automatizzata con branding che migliora la collaborazione e il processo decisionale.
Le integrazioni includono Salesforce, HubSpot, Google Analytics, Facebook Ads, QuickBooks e Snowflake, collegando i dati tra i principali sistemi GTM e finanziari.
Pros and Cons
Pros:
- Fornisce insight basati sui dati per migliorare il processo decisionale.
- Dispone di una varietà di connettori dati per un'integrazione senza soluzione di continuità.
- Offre dashboard personalizzabili per visualizzare efficacemente i dati.
Cons:
- Alcuni utenti potrebbero trovare delle limitazioni nelle funzionalità di analytics avanzate rispetto ad altri strumenti BI.
- Alcuni utenti potrebbero riscontrare problemi di velocità nel caricamento dei dati con insiemi di dati di grandi dimensioni.

La migliore soluzione di business intelligence per la creazione autonoma di report
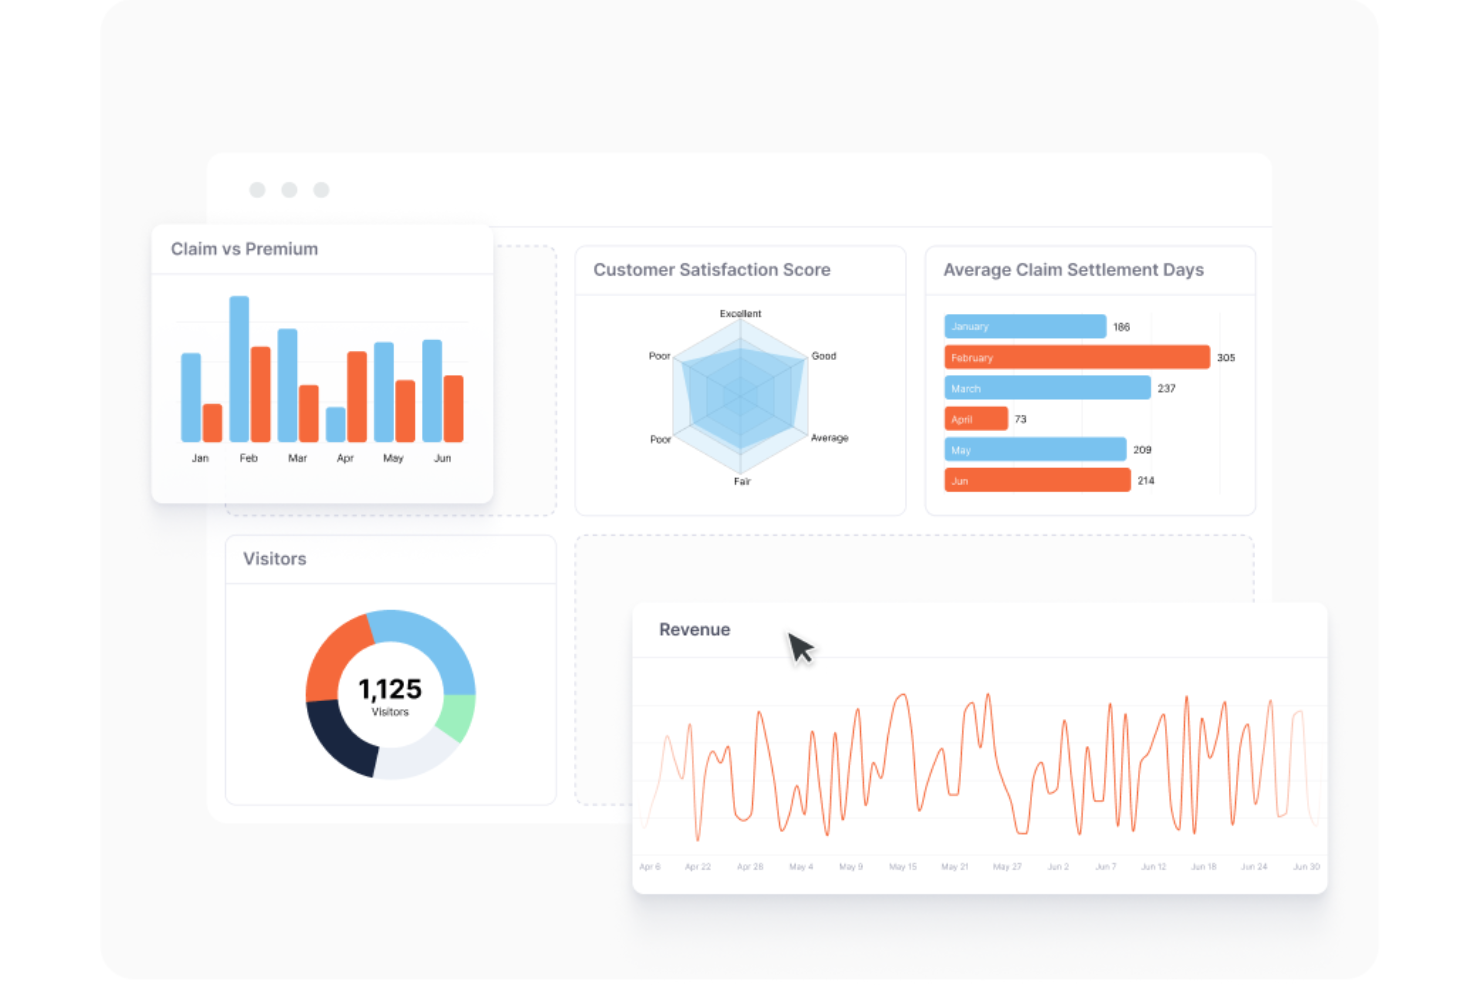
Wyn Enterprise è una piattaforma di business intelligence (BI) che consente la creazione autonoma di report e la visualizzazione dei dati in tempo reale per team di diversi settori. Combina dashboard interattive, una solida governance dei dati e opzioni di distribuzione flessibili per aiutare le organizzazioni a prendere decisioni più rapide e basate sui dati.
Perché ho scelto Wyn Enterprise: Wyn Enterprise si distingue per le sue capacità di analisi self-service e dashboard interattive: due funzionalità che permettono ai team di esplorare e interpretare i dati senza il forte coinvolgimento dell'IT. Il suo modello di licenza a tariffa fissa permette inoltre di scalare in modo conveniente al crescere della domanda degli utenti, risultando interessante per l'adozione in tutta l'azienda.
Funzionalità principali e integrazioni:
Le funzionalità includono dashboard interattive, report self-service, avvisi personalizzabili, BI incorporata, governance dei dati e opzioni di distribuzione flessibili sia per ambienti cloud che on-premises. Queste capacità semplificano la creazione di report, migliorano l’accessibilità ai dati e garantiscono la conformità tra i team.
Tra le integrazioni figurano Microsoft SQL Server, MySQL, PostgreSQL, Oracle, SAP HANA, Amazon Redshift, Google BigQuery, MongoDB, Microsoft Excel e file CSV.
Pros and Cons
Pros:
- Supporta la creazione autonoma di report, permettendo agli utenti di creare e gestire i report in modo indipendente.
- Propone opzioni di distribuzione flessibili per ambienti on-premises o cloud.
- Offre un modello di licenza a tariffa fissa che consente la scalabilità illimitata degli utenti.
Cons:
- Le informazioni sui prezzi sono disponibili solo su richiesta.
- Il periodo di prova breve potrebbe non essere sufficiente ai team aziendali per comprendere appieno lo strumento prima dell’acquisto.

Strategy
Il miglior software di business intelligence per analytics self-service
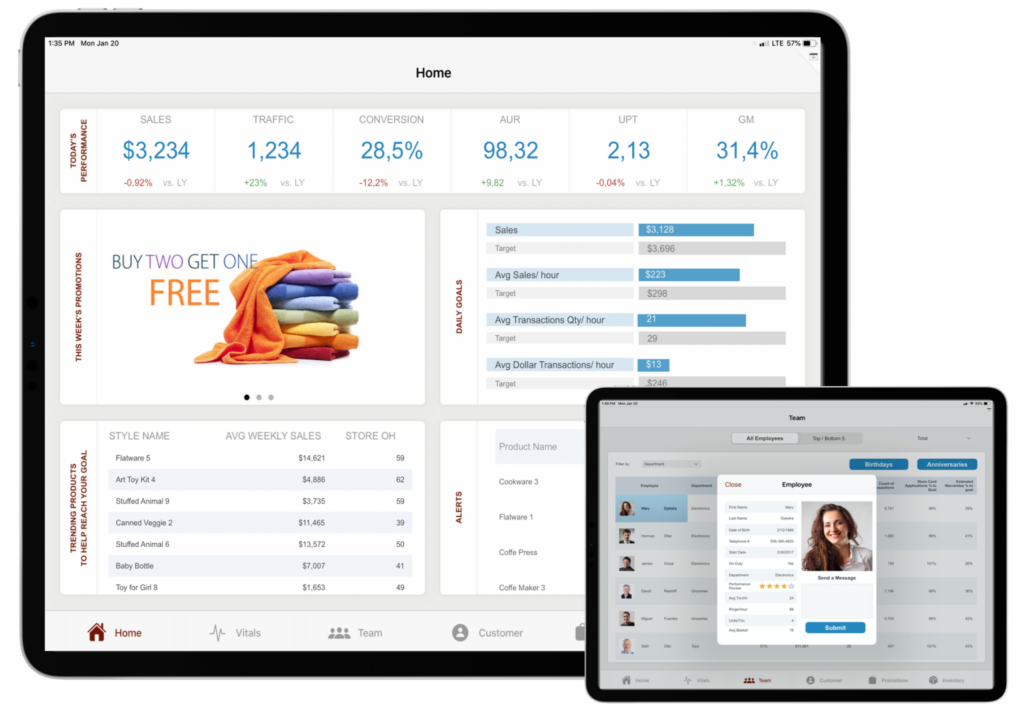
MicroStrategy è uno strumento di BI basato sul web che aiuta i team RevOps a creare applicazioni BI self-service per le loro aziende.
Perché ho scelto MicroStrategy: MicroStrategy consente di creare applicazioni di analytics con marchio aziendale che i membri del team possono utilizzare per generare autonomamente i propri report con il minimo supporto. Questo software è ideale per i reparti RevOps che vogliono incoraggiare le persone degli altri dipartimenti a gestire autonomamente le attività sui dati più semplici.
MicroStrategy permette di creare applicazioni mobili affinché i membri del team possano eseguire query anche in mobilità. È possibile creare app che consentono ad altri di monitorare autonomamente le proprie spese o la fatturazione, liberando così parte del proprio tempo.
Funzionalità e integrazioni principali di MicroStrategy:
Le funzionalità includono personalizzazione dello spazio di lavoro, creazione di applicazioni no-code o low-code, analytics aumentata, machine learning e automazione, e approfondimenti guidati dai dati.
Le integrazioni includono Allego Sales Enablement, FoxPlan, LoginRadius, Microsoft Word, Microsoft Excel, MindsDB, MongoDB, Salesforce, Vibe e altre opzioni software.
Pros and Cons
Pros:
- Dashboard dall'aspetto gradevole
- Facile da personalizzare
- Analizza e interpreta grandi quantità di dati
Cons:
- L'interfaccia sembra un po' datata
- Potrebbe offrire più opzioni di visualizzazione

Reveal
Ideale per l'integrazione di analytics embedded

Reveal BI è una piattaforma di business intelligence che incorpora l'analisi dei dati direttamente nelle applicazioni per team SaaS e aziendali. Combina approfondimenti guidati dall'IA, dashboard personalizzabili ed esplorazione dei dati in tempo reale per aiutare le organizzazioni a prendere decisioni più rapide e informate senza interrompere i flussi di lavoro.
Perché ho scelto Reveal BI: Reveal si distingue per consentire un'analisi integrata senza soluzione di continuità con un'elevata personalizzazione e una forte flessibilità di integrazione. La sua attenzione alla connettività in tempo reale e all'analisi predittiva aiuta CRO e responsabili delle operazioni di ricavo a trasformare i dati operativi in informazioni utili all'interno dello stack software esistente—ideale per organizzazioni guidate dal prodotto che vogliono mettere in evidenza gli insight dove gli utenti lavorano già.
Funzionalità e integrazioni principali:
Le funzionalità includono analisi potenziate dall'IA, dashboard personalizzabili e visualizzazioni drag-and-drop per un'esplorazione istantanea dei dati. Queste capacità semplificano la presentazione dei dati e supportano l'analisi self-service in tutti i reparti.
Le integrazioni includono API REST, Java e JavaScript, con supporto per data warehouse e sistemi aziendali comuni.
Pros and Cons
Pros:
- Reveal semplifica l'integrazione dell'analisi dei dati, rendendolo facile da usare per i team di finanza e operazioni.
- Permette di creare rapidamente report e dashboard con funzionalità di visualizzazione automatizzate.
- Lo strumento offre aggregazione dei dati in tempo reale e funzionalità di analisi approfondita per insight più dettagliati.
Cons:
- Alcuni utenti notano che Reveal è ancora in fase di sviluppo e manca di maturità in alcune aree.
- Le opzioni di personalizzazione come tipi di grafici e combinazioni di colori possono essere limitate.

Il miglior software di business intelligence per insight guidati dall'intelligenza artificiale
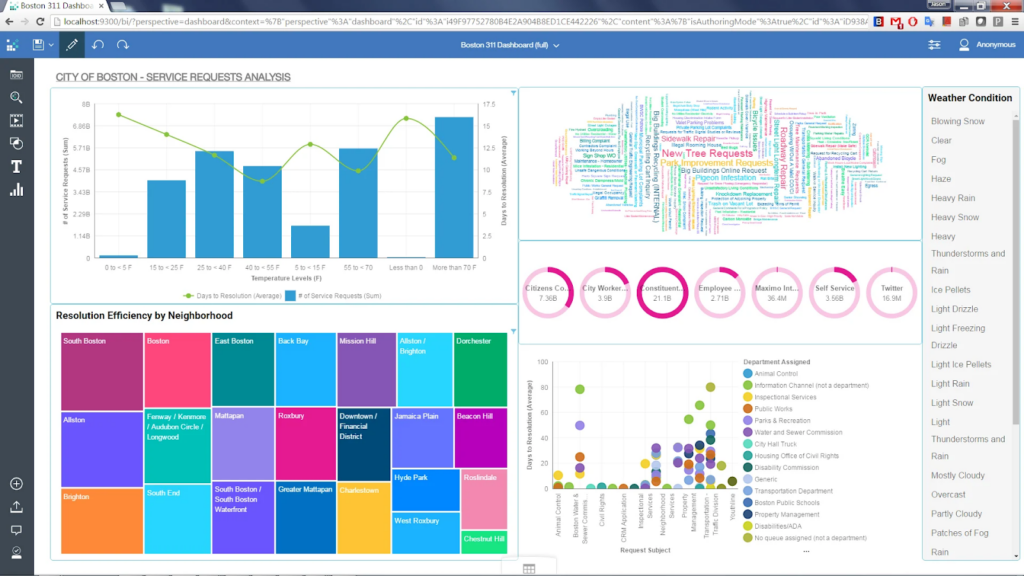
IBM Cognos Analytics with Watson è una soluzione di business intelligence che consente ai team di revenue di interpretare i propri dati grazie all'intelligenza artificiale (AI).
Perché ho scelto IBM Cognos Analytics with Watson: IBM Cognos Analytics with Watson si distingue per la sua AI proattiva. L’algoritmo del software analizza i tuoi dati e ti aiuta a individuare tendenze e schemi, così puoi scoprire insight con facilità. Questo rende la soluzione molto interessante per i team RevOps che devono analizzare e interpretare grandi quantità di dati in tempi brevi.
IBM Cognos Analytics with Watson è personalizzabile, permettendoti di adattare la soluzione alle tue esigenze specifiche. I modelli predittivi del software ti aiutano a prevedere tendenze e risultati futuri, migliorando il tuo processo decisionale.
Caratteristiche e integrazioni principali di IBM Cognos Analytics with Watson:
Le funzionalità includono un assistente AI, analisi predittiva, modellazione dei dati, alberi decisionali, report interattivi, dashboard dinamiche e report personalizzati.
Le integrazioni includono Dropbox, Facebook, Google Drive, Microsoft Excel, Microsoft Power BI, Oracle, Salesforce, SQL Server, Tableau e Twitter.
Pros and Cons
Pros:
- Gestisce grandi volumi di dati senza problemi
- Aiuta a individuare e interpretare schemi
- Il processore AI ripulisce i dati per te
Cons:
- Può sembrare travolgente
- Le risorse di apprendimento sono difficili da trovare
Altri software di business intelligence
Ecco alcune altre opzioni che non sono state incluse nell’elenco dei migliori software di business intelligence:
- Oracle Analytics
Il miglior software di business intelligence per aziende di grandi dimensioni
- Tableau CRM Analytics
Miglior software di business intelligence per la visualizzazione collaborativa dei dati
- SAP BusinessObjects
La migliore piattaforma di business intelligence per la previsione dei dati
- Qlik Sense
Il miglior software di business intelligence per dashboard interattivi
- Microsoft Power BI
Il miglior software di business intelligence per le opzioni di visualizzazione dei dati
- Klipfolio PowerMetrics
Il miglior software di business intelligence per piccoli team
- Sisense
Il miglior software di business intelligence per agenzie RevOps
- Coefficient
Ideale per accesso ai dati in tempo reale
- Phocas
Miglior software di business intelligence per reportistica semplice
- Metrics Insight
Miglior software di business intelligence per la consolidazione dei dati
- Slingshot
Ideale per integrare BI con i flussi di lavoro di progetto
- Yurbi
Miglior software di business intelligence per la creazione di report senza codice


Recensioni correlate dei software di business intelligence
Se non hai ancora trovato ciò che cerchi, dai un'occhiata a questi strumenti strettamente correlati ai software di business intelligence che abbiamo testato e valutato.
- Software CRM
- Software per le vendite
- Software per la gestione dei lead
- Software per la gestione dei contratti
- Sistema di gestione dei ricavi
- Software CPQ
Come Valuto il Software di Business Intelligence
Divido la mia valutazione in due livelli: i requisiti di base che uno strumento deve soddisfare — connettività CRM, interrogazione ad hoc e dashboard — e quei fattori che differenziano i migliori dal resto.
Funzionalità di Base (Requisiti Minimi per Questa Lista)
Quando seleziono gli strumenti per la mia lista, valuto ciascuno su una scala da 0 (non offre la funzionalità) a 5 (eccelle in quest'area) per ogni funzionalità fondamentale elencata di seguito. Poi, calcolo il punteggio totale dello strumento trasformandolo in percentuale. Ogni strumento deve raggiungere un punteggio minimo totale del 65% per essere considerato per l'inclusione.
- Connettività alle fonti dati: Verifico quanti connettori nativi offre uno strumento e se copre i sistemi utilizzati dai team RevOps—CRM come Salesforce e HubSpot, oltre a database come Snowflake e BigQuery.
- Dashboard Interattive e Visualizzazione: La libreria di grafici di ciascuno strumento, le funzionalità di cross-filtering e drill-down mi indicano quanto bene il tuo team può monitorare la salute della pipeline e la conversione del funnel senza limitarsi a screenshot statici.
- Interrogazioni Ad-Hoc e Analisi Self-Service: Cerco funzioni di esplorazione drag-and-drop e salvataggio delle query affinché un ops analyst possa suddividere i dati sui tassi di successo per segmento o regione senza dover aprire una richiesta al team tecnico.
- Data Modeling e Trasformazione: Qui sono importanti i livelli semantici, i campi calcolati e le metriche governate—strumenti come Looker e Power BI gestiscono questi aspetti in modo diverso, e valuto come ciascuno standardizza gli indicatori chiave RevOps tra i team.
- Reportistica Programmata e Avvisi: Valuto se una piattaforma può inviare automaticamente un aggiornamento della pipeline il lunedì mattina su Slack o via email e se può attivare avvisi quando la velocità delle trattative scende sotto una certa soglia.
- Analisi Embedded e Predittive: Mi concentro su previsioni, rilevamento dei trend e insight guidati dall'AI—funzionalità che aiutano un CRO a prevedere le entrate trimestrali o segnalare rinnovi a rischio prima che vadano persi.
Una volta ottenuta una lista di strumenti che soddisfano questi criteri, considero cosa distingue ciascuna piattaforma.
Fattori di Differenziazione (Cosa Distingue i Fornitori)
Ecco come confronto e metto a confronto i diversi fornitori:
Funzionalità Distintive
Il reverse ETL è importante perché gli insight fermi su una dashboard non fanno chiudere contratti—cerco strumenti che riportino i dati in Salesforce o Outreach affinché i commerciali possano agire direttamente nel loro flusso di lavoro. Un copilota AI integrato è un altro fattore distintivo, soprattutto quando un ops analyst necessita di una risposta rapida su raggiungimento delle quote senza dover creare un report da zero. Valuto anche le funzionalità collaborative come i commenti in dashboard e la condivisione su Slack, che aiutano i team RevOps ad allineare vendite e marketing sugli stessi dati attuali.
Oltre alle Funzionalità
La profondità di integrazione con il tech stack RevOps è uno dei primi aspetti che valuto—uno strumento BI che si collega in modo nativo al tuo CRM, all'automazione del marketing e al data warehouse ti fa risparmiare settimane di lavoro di integrazione. Considero anche come funziona la licenza quando devi scalare da un team ops di cinque persone a centinaia di visualizzatori di dashboard tra vendite e customer success. La governance è fondamentale: verifico la presenza di sicurezza a livello di riga e supporto SSO, perché i dati territoriali e le quote non dovrebbero essere visibili a chiunque nell'organizzazione.
Come scegliere un software di business intelligence
Con così tante soluzioni software di business intelligence diverse disponibili, può essere difficile decidere quale strumento sia più adatto alle proprie esigenze.
Mentre selezioni, provi e scegli il software di business intelligence, considera quanto segue:
- Quale problema stai cercando di risolvere - Inizia identificando la lacuna nelle funzionalità del software di business intelligence che stai cercando di colmare, per chiarire quali caratteristiche e funzionalità lo strumento deve offrire.
- Chi dovrà utilizzarlo - Per valutare costi e requisiti, considera chi utilizzerà il software e di quante licenze avrai bisogno. Dovrai valutare se l'accesso sarà necessario solo per i responsabili delle operazioni di ricavi o per l'intera organizzazione. Una volta chiarito questo aspetto, vale la pena considerare se stai dando priorità alla facilità d'uso per tutti oppure alla velocità per gli utenti esperti del software di business intelligence.
- Con quali altri strumenti dovrà funzionare - Chiarisci quali strumenti stai sostituendo, quali rimarranno in uso e con quali strumenti dovrai integrarlo, come software di contabilità, CRM o gestione delle risorse umane. Dovrai decidere se gli strumenti dovranno integrarsi tra loro oppure se puoi sostituire più strumenti con un unico software di business intelligence integrato.
- Quali risultati sono importanti - Considera il risultato che il software deve fornire affinché possa essere considerato un successo. Considera quale capacità vuoi acquisire o cosa vuoi migliorare e come misurerai il successo. Ad esempio, un risultato potrebbe essere la possibilità di ottenere una maggiore visibilità sulle prestazioni. Potresti confrontare le funzionalità dei software di business intelligence fino allo sfinimento, ma se non stai pensando ai risultati che vuoi ottenere, potresti sprecare molto tempo prezioso.
- Come funzionerebbe all'interno della tua organizzazione - Considera la scelta del software insieme ai tuoi flussi di lavoro e alla metodologia di gestione delle attività. Valuta cosa funziona bene e quali aree stanno causando problemi che devono essere risolti. Ricorda che ogni azienda è diversa: non dare per scontato che, solo perché uno strumento è popolare, funzionerà anche nella tua organizzazione.
Tendenze nei software di business intelligence per 2026
Il software di business intelligence (BI) continua a evolversi rapidamente, spinto dalla crescente necessità di prendere decisioni basate sui dati e di gestire strategicamente le operazioni di ricavi. Gli ultimi aggiornamenti dei prodotti, i comunicati stampa e i registri delle versioni dei principali strumenti di BI rivelano tendenze chiave che stanno plasmando il futuro della business intelligence. Queste tendenze riflettono uno spostamento più ampio verso soluzioni più avanzate, intuitive e integrate, progettate per migliorare l'analisi dei dati, la visualizzazione e il processo decisionale complessivo. Esploriamo le tendenze più rilevanti nei software di BI, pensate per rispondere alle esigenze e alle sfide dei responsabili delle operazioni di ricavi.
Analisi avanzate e integrazione dell'intelligenza artificiale
- Analisi predittiva e intelligenza artificiale: gli strumenti di BI incorporano sempre più algoritmi di intelligenza artificiale e apprendimento automatico per offrire analisi predittive, automatizzando il processo di identificazione delle tendenze, previsione dei risultati futuri e fornitura di raccomandazioni per le decisioni strategiche.
- Evidenza: introduzione di funzionalità che generano automaticamente analisi e prevedono il comportamento dei clienti, le tendenze delle vendite e le dinamiche di mercato.
Integrazione e gestione dei dati migliorate
- Integrazione fluida dei dati: la possibilità di integrare dati provenienti da un'ampia gamma di fonti, inclusi servizi cloud, database locali e applicazioni di terze parti, sta diventando una funzionalità standard e semplifica il processo di consolidamento dei dati.
- Evidenza: nuove integrazioni con piattaforme cloud e applicazioni aziendali diffuse per consentire una visione completa dei dati dell'organizzazione.
Esperienza utente e accessibilità
- Strumenti di BI self-service: si pone sempre maggiore enfasi sulle funzionalità self-service, che consentono agli utenti senza competenze tecniche di creare facilmente report e dashboard e di eseguire analisi dei dati, democratizzando l'accesso agli insight di BI.
- Evidenza: sviluppo di interfacce intuitive con funzionalità di trascinamento e rilascio e di elaborazione del linguaggio naturale per interrogare i dati.
BI collaborativa e mobile
- Funzionalità di collaborazione migliorate: i software di BI si concentrano sul miglioramento della collaborazione tra i team offrendo dashboard condivise, condivisione dei dati in tempo reale e funzionalità per aggiungere commenti, favorendo un approccio più coeso al processo decisionale basato sui dati.
- Evidenza: implementazione di spazi di lavoro condivisi e sistemi di notifica per gli aggiornamenti e le modifiche ai report.
Funzionalità innovative
- Analisi integrate: L'integrazione delle funzionalità di BI direttamente nelle applicazioni aziendali, fornendo agli utenti informazioni e analisi nel contesto dei loro flussi di lavoro quotidiani, sta diventando sempre più diffusa.
- Prova: Espansione delle funzionalità di analisi integrate che consentono alle applicazioni di terze parti di incorporare report e dashboard BI personalizzati.
Funzionalità in declino
- Report statici: La domanda di report statici e predefiniti sta diminuendo a favore di report dinamici e interattivi che gli utenti possono personalizzare ed esplorare in base alle proprie esigenze e domande specifiche.
- Prova: Passaggio verso visualizzazioni interattive e strumenti di reporting ad hoc.
Queste tendenze indicano un passaggio significativo verso strumenti di BI più intelligenti, integrati e facili da usare, con una forte enfasi sul supporto alle operazioni di fatturato attraverso un'analisi dei dati migliorata, informazioni predittive e un processo decisionale collaborativo. Poiché il panorama della BI continua a evolversi, i responsabili delle operazioni di fatturato dovrebbero concentrarsi sulla selezione di strumenti in linea con queste tendenze per massimizzare la capacità della propria organizzazione di analizzare efficacemente i dati, prendere decisioni informate e favorire la crescita strategica.
Che cos'è il software di business intelligence?
Il software di business intelligence è un insieme di strumenti per analizzare i dati aziendali. Aiuta a raccogliere, elaborare e trasformare i dati in informazioni utili attraverso report, visualizzazioni e analisi. Questo software supporta il processo decisionale aggregando dati provenienti da più fonti e presentandoli in un formato comprensibile.
I vantaggi del software di business intelligence includono processi decisionali migliorati, una maggiore efficienza operativa e una migliore comprensione delle tendenze del mercato. Aiuta le aziende a identificare le opportunità di crescita, ottimizzare i processi e ottenere un vantaggio competitivo attraverso strategie informate. Sfruttando i dati in modo efficace, le aziende possono prendere decisioni proattive basate sulla conoscenza.
Funzionalità del software di business intelligence
Quando selezioni un software di business intelligence, presta attenzione alle seguenti funzionalità chiave:
- Integrazione dei dati: Riunisce informazioni provenienti da più fonti, come fogli di calcolo, database o applicazioni cloud, per ottenere una visione unificata dell'azienda senza dover combinare manualmente dati eterogenei.
- Dashboard interattive: Presentano dati complessi in formati visivi facili da comprendere e personalizzabili, che consentono di esaminare in dettaglio e manipolare le informazioni più importanti.
- Reporting avanzato: Genera report dettagliati e flessibili su richiesta, sia che tu abbia bisogno di una panoramica di alto livello sia di un'analisi approfondita di KPI specifici.
- Analisi in tempo reale: Consente di accedere a informazioni aggiornate al minuto per reagire rapidamente ai cambiamenti e alle opportunità aziendali nel momento in cui si verificano, non a posteriori.
- Visualizzazione dei dati: Trasforma i numeri in grafici, diagrammi e mappe di calore efficaci, rendendo molto più semplice individuare tendenze e valori anomali, senza le complicazioni dei fogli di calcolo.
- Strumenti di collaborazione: Consentono ai membri del team di condividere dashboard, aggiungere annotazioni ai report o lavorare fianco a fianco sulle analisi, anche se si trovano in parti diverse del mondo.
- Controlli di accesso basati sui ruoli: Permettono di scegliere esattamente chi può visualizzare o modificare determinati dati, mantenendo al sicuro le informazioni importanti e consentendo al team di lavorare al meglio.
- Accessibilità da dispositivi mobili: Permette di rimanere informati e prendere decisioni al volo con pieno accesso alle informazioni dal telefono o dal tablet.
- Pulizia e preparazione dei dati: Ripulisce automaticamente le informazioni disordinate o incoerenti prima dell'inizio dell'analisi, facendo risparmiare molto tempo e garantendo l'accuratezza.
- Scalabilità: Garantisce che il software di business intelligence possa crescere insieme all'azienda, gestendo un numero maggiore di utenti e set di dati più ampi durante l'espansione.
Funzionalità comuni di intelligenza artificiale del software di business intelligence
Oltre alle funzionalità standard del software di business intelligence elencate sopra, molte di queste soluzioni stanno integrando l'intelligenza artificiale con funzionalità come:
- Analisi del sentiment: Analizza i dati testuali provenienti da fonti come sondaggi o social media per capire come si sentono davvero i clienti o i dipendenti, senza dover esaminare manualmente ogni commento.
- Analisi predittiva: Utilizza l'apprendimento automatico per prevedere le tendenze future, aiutandoti a pianificare con sicurezza invece di limitarti a reagire a ciò che è già accaduto.
- Interrogazione in linguaggio naturale: Permette di porre domande sui propri dati in italiano corrente e ottenere immediatamente risposte comprensibili, senza bisogno di programmazione o gergo tecnico.
- Informazioni automatiche: Fa emergere automaticamente raccomandazioni utili o anomalie significative nei dati, così non devi cercare personalmente ogni informazione preziosa nascosta.
- Rilevamento delle anomalie: Individua in tempo reale schemi insoliti o valori anomali, avvisandoti immediatamente di potenziali problemi o opportunità inattese.
- Preparazione dei dati basata sull'intelligenza artificiale: Semplifica il tedioso lavoro di pulizia, categorizzazione e combinazione dei dati, lasciando che gli algoritmi lo gestiscano in modo rapido e accurato.
Vantaggi del software di intelligenza aziendale
Il software di intelligenza aziendale (BI) svolge un ruolo fondamentale nella trasformazione dei dati in informazioni utili che guidano le decisioni strategiche e migliorano l'efficienza operativa. Per le organizzazioni che desiderano ottimizzare le proprie operazioni di fatturato, il software BI offre una serie di strumenti progettati per analizzare, visualizzare e sfruttare i dati in modo efficace. Ecco cinque vantaggi principali che il software BI offre agli utenti e alle organizzazioni, soprattutto a quelle che operano nell'ambito della gestione delle operazioni di fatturato.
- Processo decisionale basato sui dati: Fornisce alle organizzazioni informazioni supportate dai dati. Questo vantaggio consente agli utenti di prendere decisioni strategiche informate, riducendo le congetture e aumentando la precisione delle strategie aziendali mirate alla crescita del fatturato.
- Maggiore efficienza operativa: Semplifica e automatizza i processi di analisi dei dati. Automatizzando le attività di elaborazione ordinaria dei dati, le organizzazioni possono allocare le risorse in modo più efficace, concentrandosi sulle attività strategiche che contribuiscono direttamente alla generazione di fatturato.
- Migliori informazioni sui clienti: Offre una comprensione più approfondita del comportamento e delle preferenze dei clienti. Queste informazioni consentono alle aziende di adattare la propria offerta e le strategie di marketing per soddisfare più efficacemente le esigenze dei clienti, aumentando la soddisfazione e la fidelizzazione.
- Vantaggio competitivo: Offre un vantaggio competitivo grazie all'accesso a informazioni aziendali in tempo reale. Restare al passo con le tendenze del mercato e le strategie dei concorrenti permette alle aziende di adattarsi rapidamente, cogliendo le opportunità e riducendo i rischi in modo più efficace.
- Aumento della crescita del fatturato: Individua opportunità per ottimizzare il fatturato e ridurre i costi. Evidenziando le aree in cui è possibile ottenere maggiore efficienza e sviluppare nuovi flussi di fatturato, il software BI contribuisce direttamente alla crescita del fatturato e della redditività.
Costi e prezzi del software di intelligenza aziendale
Il software di intelligenza aziendale (BI) è fondamentale per le organizzazioni che desiderano sfruttare i dati per prendere decisioni strategiche. Gli strumenti BI variano notevolmente per funzionalità, scalabilità e prezzo, adattandosi ad aziende di tutte le dimensioni e di diversi settori. Dalle soluzioni progettate per i piccoli team che si avvicinano all'analisi dei dati alle piattaforme complete per ottenere informazioni a livello aziendale, comprendere la gamma di opzioni dei piani e i relativi prezzi è essenziale per scegliere uno strumento BI in linea con le esigenze e il budget della propria organizzazione.
Tabella di confronto dei piani per il software di intelligenza aziendale
| Tipo di piano | Prezzo medio | Funzionalità comunemente incluse | Ideale per |
| Gratuito | $0 | - Visualizzazione di base dei dati - Integrazione limitata delle fonti di dati - Funzionalità di base per la creazione di report | Singoli utenti o piccoli team che iniziano a utilizzare gli strumenti BI |
| Base | $10 - $25 per utente/mese | - Visualizzazione avanzata dei dati - Maggiore integrazione delle fonti di dati - Pannelli di controllo personalizzabili - Funzionalità di condivisione di base | Piccole e medie imprese che necessitano di strumenti BI più completi |
| Professionale | $50 - $100 per utente/mese | - Analisi avanzate - Integrazione più ampia delle fonti di dati - Strumenti di collaborazione - Opzioni di personalizzazione più estese | Aziende in crescita che necessitano di analisi avanzate e collaborazione |
| Aziendale | $100+ per utente/mese | - Suite completa di analisi - Integrazione completa dei dati - Funzionalità di sicurezza avanzate - Assistenza dedicata - Opzioni di scalabilità | Grandi aziende che necessitano di soluzioni BI complete e scalabili |
Quando valuti quale piano software BI scegliere, è importante considerare sia le esigenze analitiche immediate sia la strategia dei dati a lungo termine. Scegli un piano che non solo rientri nel budget attuale, ma che offra anche la flessibilità necessaria per crescere insieme alle capacità di analisi dei dati della tua organizzazione. Bilanciare i costi con il potenziale delle informazioni utili ti permetterà di fare una scelta che genera valore e supporta decisioni informate in tutta l'organizzazione.
Domande frequenti sul software di business intelligence
Ulteriore software RevOps
Ecco alcune altre opzioni software che potresti prendere in considerazione.
- Miglior software per le vendite
- Miglior software CRM gratuito
- Software per la gestione dei clienti
- Software per la visualizzazione dei dati
- Software per l'analisi predittiva
- Software per le previsioni di vendita
- Software per i report sulle vendite
- Software per l'intelligence sulle vendite
- Sistemi di gestione dei ricavi
- Software per gli indicatori KPI
- Software per il monitoraggio delle vendite
Conclusione
Scegliere il giusto software di analisi dei dati aziendali è fondamentale per qualsiasi organizzazione che voglia sfruttare al meglio i propri dati. Questi strumenti consentono alle aziende di analizzare le informazioni in modo efficace, favorendo decisioni migliori, una maggiore efficienza operativa e una competitività più elevata. Sfruttando la potenza dei dati, le aziende possono ottimizzare i processi, individuare opportunità di crescita e mantenere un vantaggio nel proprio settore. Spero che questo elenco ti abbia aiutato a trovare alcune ottime opzioni di strumenti BI per il tuo team.
Prima di andare, non dimenticare di iscriverti alla nostra newsletter di RevOps per ricevere direttamente nella tua casella di posta consigli pratici dai leader del settore.