

10 Best Business Intelligence Software For RevOps In 2026

10 Best Business Intelligence Software Shortlist


As a RevOps manager, choosing the right business intelligence software can be a daunting task. This article highlights the top 20 options available in 2026, offering insights into their features and benefits to streamline your operations and boost revenue.
Why Trust Our Software Reviews
We’ve been testing and reviewing RevOps software since 2022. As RevOps leaders ourselves, we know how critical and difficult it is to make the right decision when selecting software.
We invest in deep research to help our audience make better software purchasing decisions. We’ve tested more than 2,000 tools for different RevOps use cases and written over 1,000 comprehensive software reviews. Learn how we stay transparent & our software review methodology.
Best Business Intelligence Software Summary
| Tool | Best For | Trial Info | Price | ||
|---|---|---|---|---|---|
| 1 | Best for unified data analytics platform | Free edition available + 14-day free trial | From $0.15/DBU | Website | |
| 2 | Best business intelligence software for novice RevOps teams | 15-day free trial | From $30/month (billed annually) | Website | |
| 3 | Best business intelligence software for embedded analytics | Free demo available | Pricing upon request | Website | |
| 4 | Best for consistent data governance | Free trial + free demo available | Pricing upon request | Website | |
| 5 | Best business intelligence software for low-code data modeling | Free trial + demo available | Pricing upon request | Website | |
| 6 | Best business intelligence software for dynamic data visualization | Free demo available | Pricing upon request | Website | |
| 7 | Best business intelligence software for self-service reporting | Not available | Contact for pricing. | Website | |
| 8 | Best business intelligence software for self-service analytics | 14-day free trial + free demo available | From $13/user/month | Website | |
| 9 | Best for Embedded Analytics Integration | Free demo available | Pricing upon request | Website | |
| 10 | Best business intelligence software for AI-driven insights | 30-day free trial available | From $11.25/user/month | Website |
Best Business Intelligence Software Reviews
Here’s a brief description of each business intelligence software that showcases each systems best use case, noteworthy features, pros & cons, user interface, and pricing information.
Best for unified data analytics platform
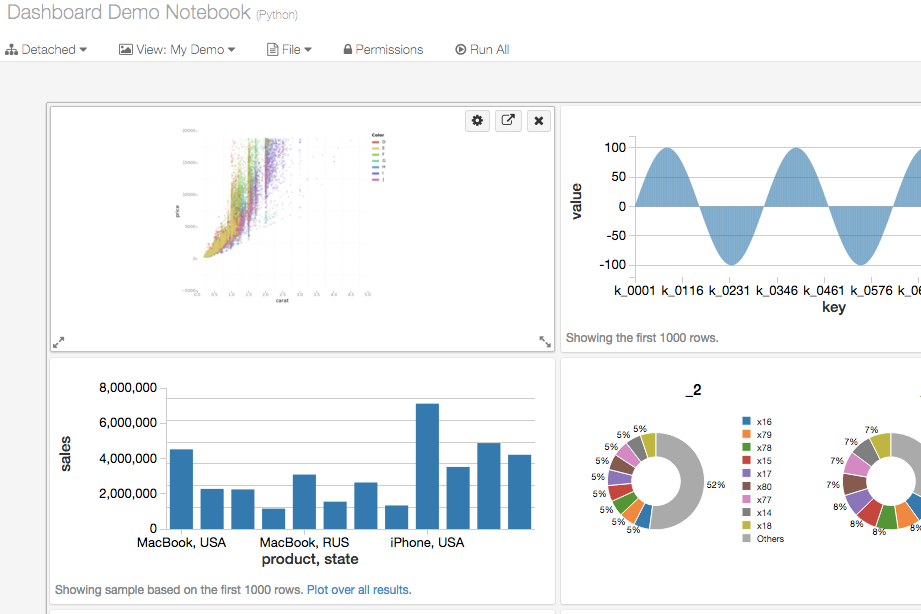
Databricks is a cloud-native analytics platform that unifies data warehousing, machine learning, and AI-powered BI into one scalable environment for data and revenue teams.
Who Is Databricks Best For?
Databricks is a strong fit for data-mature enterprises with large-scale data infrastructure needs and dedicated data engineering or analytics engineering teams.
Why I Picked Databricks
I picked Databricks as one of the best because no other platform collapses the gap between raw data and revenue insight quite like this. The lakehouse architecture means my team isn't shuttling data between a warehouse, a BI tool, and a separate ML environment. Unity Catalog's business semantics layer enforces a single definition of metrics like pipeline or ARR across dashboards, AI agents, and downstream tools. On top of that, Genie lets non-technical revenue stakeholders query data in plain language, without waiting on a data analyst to build a new report.
Databricks Key Features
- AI/BI dashboards: A native drag-and-drop dashboard builder that lets your team create and publish interactive visualizations directly on top of lakehouse data.
- Serverless SQL warehouses: On-demand SQL compute that scales automatically, so revenue analysts can run ad hoc queries without provisioning or managing infrastructure.
- Predictive analytics via SQL: Built-in functions that let analysts call ML and GenAI models directly from SQL queries to generate forecasts and scored outputs.
- Delta Lake storage layer: An open-source transactional storage format that ensures data reliability, versioning, and consistency across all analytics workloads.
Databricks Integrations
Databricks offers dozens of validated integrations through Partner Connect, spanning data ingestion, BI, data transformation, reverse ETL, and governance categories. Notable Partner Connect integrations include Fivetran, Informatica, dbt Cloud, Power BI, Tableau, Qlik Sense, Sigma Computing, ThoughtSpot, Hightouch, and Census. Databricks also provides integrations for ETL/ELT tools like Prophecy and Azure Data Factory, orchestration tools like Airflow, and SQL database tools like DataGrip and DBeaver. It's available on Zapier and provides a REST API for custom integrations.
Pros and Cons
Pros:
- Supports nearly any raw data format natively
- Ingests CRM data into a single customer view
- Unifies engineering, analytics, and ML workloads
Cons:
- Cluster mismanagement can inflate costs quickly
- Requires Python, SQL, or Scala proficiency

Best business intelligence software for novice RevOps teams
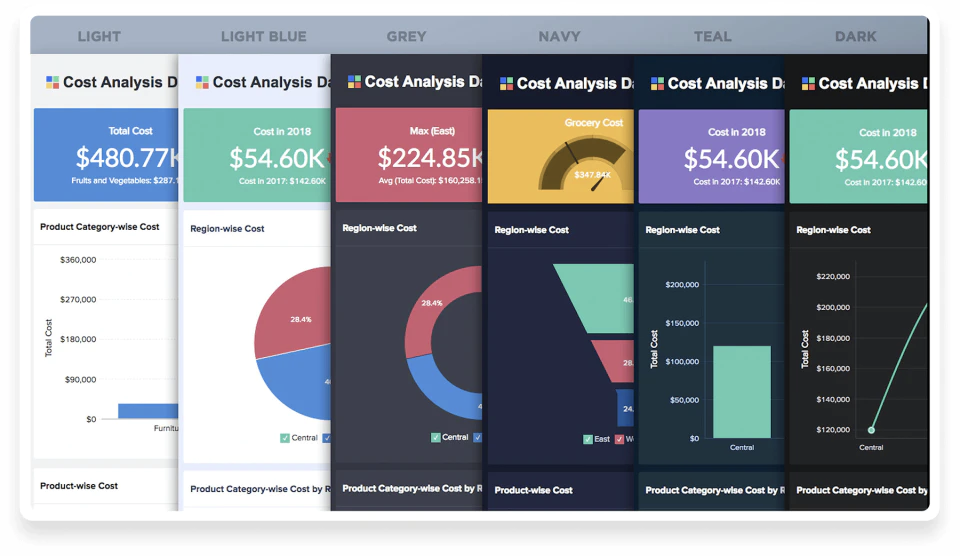
Zoho Analytics is a BI tool that helps novice rev teams leverage data when making business decisions. The software’s price range makes it accessible to small RevOps teams who are just starting out.
Why I picked Zoho Analytics: Zoho Analytics is easy to use and user-friendly for those with little to no data or technical expertise. The software has a clean layout, and its drag-and-drop interface enables you to customize your dashboards and reports without difficulty.
Zoho Analytics imports data from multiple sources, so you can examine all your business data from a central location. The interactive dashboards enable you to break down and interpret the data so you can get actionable insights.
Zoho Analytics Standout Features & Integrations:
Features include reports automation, augmented analytics, predictive analytics, contextual insights, interactive visualizations, an artificial intelligence assistant, auto-generated reports, and data alerts.
Integrations include all Zoho tools, plus HubSpot, Quickbooks Online, Sage, Salesforce, Shopify, Stripe, Xero, and other software options.
Pros and Cons
Pros:
- Includes an AI assistant
- Cost effective
- Great for those who use other Zoho solutions
Cons:
- Data synchronization happens at set intervals, so it doesn’t track data in real time
- No way to share reports directly to cloud storage
New Product Updates from Zoho Analytics

Zoho Analytics Adds Exogenous Variables to Multivariate Forecasting
Zoho Analytics introduces exogenous variables for multivariate forecasting using the VARX model. This helps forecasts account for external drivers such as marketing spend, discounts, and seasonality. For more information, visit Zoho Analytics’ official site.
 .
.
Toucan
Best business intelligence software for embedded analytics
Why I Picked Toucan
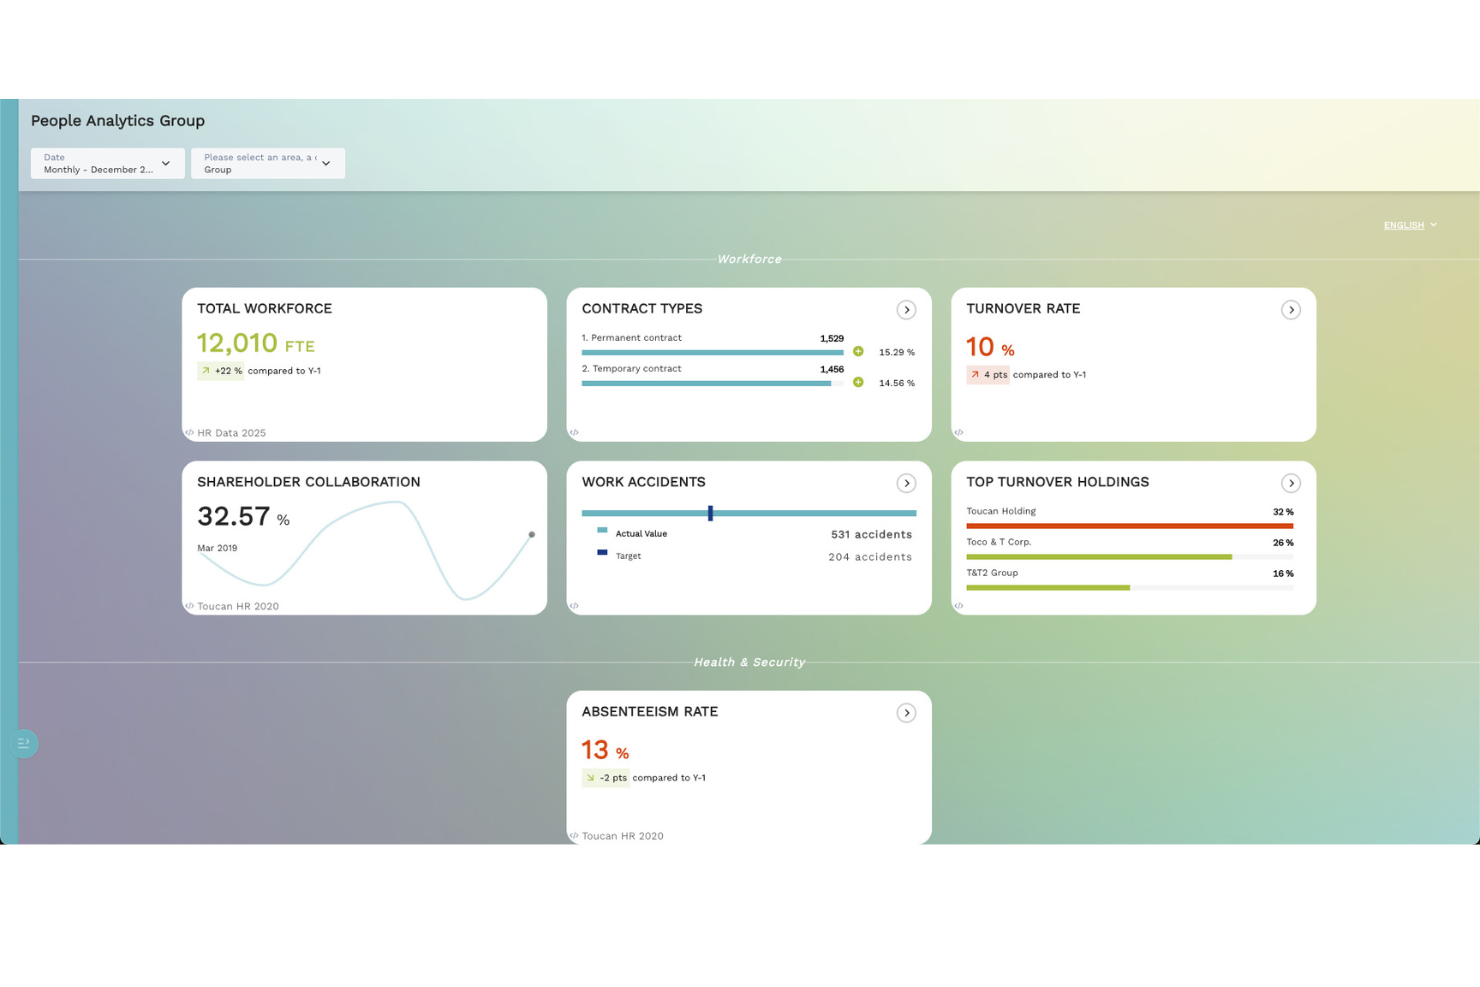
I selected Toucan because it specialises in embedding analytics into everyday apps, enabling product teams or end-users to access insights where they work rather than going into a separate BI tool. Its no-code dashboard creation makes it accessible to teams who aren’t hardcore BI devs. This helps organisations surface real-time insights seamlessly in adjacent workflows, reducing friction and boosting adoption.
Toucan Key Features
- No-code dashboard creation: Enables non-technical users to build and deploy dashboards.
- Embedded analytics support: Allows BI visualisations to be placed inside existing apps or portals.
- Real-time data feeds: Keeps embedded analytics’ data fresh and timely.
- Storytelling & narrative layer: Adds context and explanation alongside dashboards.
Toucan Integrations
Integrations include tools like Snowflake, BigQuery, MySQL, REST endpoints, Google Sheets, Salesforce, Slack, and embedded SDKs for product integration.
Pros and Cons
Pros:
- It supports a wide range of data connectors for seamless integration with major data sources.
- The software provides real-time visualization and storytelling tools that enhance decision-making.
- Toucan’s no-code platform simplifies the integration of embedded analytics for non-technical users.
Cons:
- Some find the customization options limited compared to other BI tools.
- Users report performance lags when handling large datasets.

Looker
Best for consistent data governance
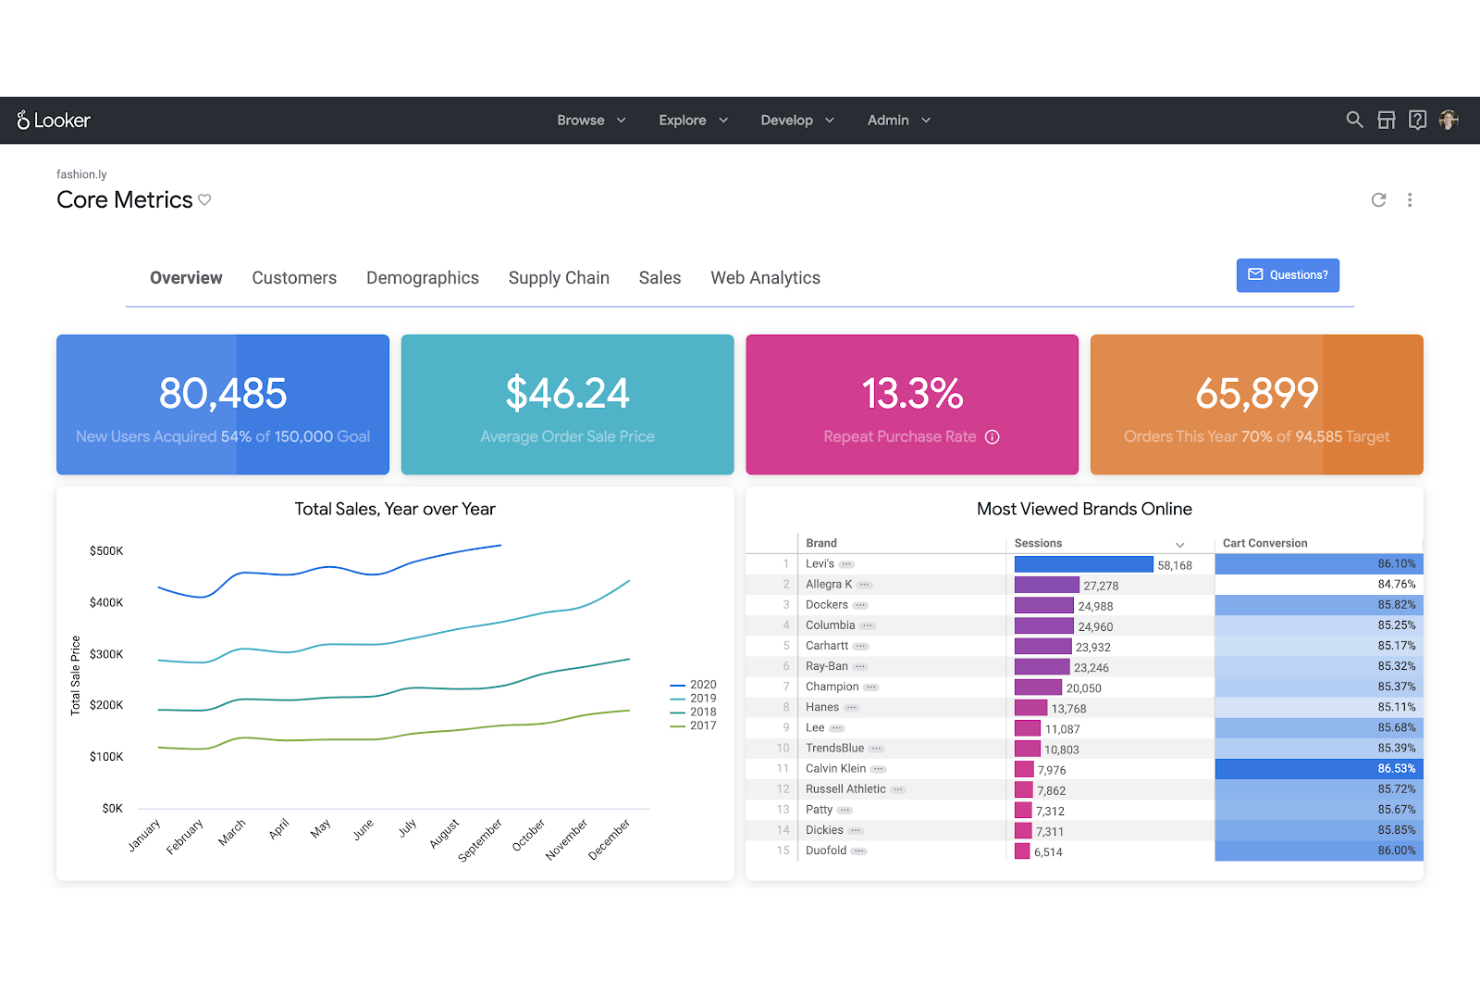
Looker is a business intelligence platform that transforms raw data into actionable insights for enterprise teams. It combines real-time analytics, semantic modeling, and AI-driven reporting to help organizations govern, explore, and monetize their data at scale. Built on Google Cloud, Looker supports embedded analytics and multi-cloud connectivity, helping teams accelerate data-driven decision-making across business functions.
Why I picked Looker: I picked Looker for its universal semantic modeling layer, which ensures consistent data governance and trusted metrics across the organization. Its integration with Google Cloud enhances scalability and security while offering seamless access to analytics tools like BigQuery and Google Workspace. Looker’s AI-powered analytics and intuitive interface make it a strong fit for leaders who want deep visibility without sacrificing agility or control.
Standout features & integrations:
Features include AI-powered analytics, a SQL-based modeling language (LookML), embedded analytics for custom data experiences, and interactive real-time dashboards that enhance visibility across teams.
Integrations include Google BigQuery, Amazon Redshift, Snowflake, Microsoft SQL Server, PostgreSQL, MySQL, Oracle, Google Sheets, Google Analytics, and Salesforce.
Pros and Cons
Pros:
- Looker integrates well with Google products, allowing seamless data analysis and reporting.
- The platform supports a wide range of data sources, including Google BigQuery and Spark, providing versatility for large data installations.
- Looker offers deep SQL modeling capabilities that enhance data management for organizations familiar with SQL.
Cons:
- The platform requires at least one SQL expert for effective use, which can be a barrier for some organizations.
- Looker’s high pricing, starting at $5,000 per month for 10 users, may not be suitable for small teams.
Domo
Best business intelligence software for low-code data modeling

Domo Business Cloud is a low-code business intelligence and analytics platform that helps rev teams build custom data apps.
Why I picked Domo Business Cloud: Domo Business Cloud enables you to bring multiple data sources together, combine their output, and interpret the data as part of a cohesive set. The software allows you to customize your dashboard, so you can check out and model data from multiple sources at the same time without writing code.
Domo Business Cloud offers a comprehensive knowledge base, so RevOps specialists should be able to use most of its features after a brief onboarding period.
Domo Business Cloud Standout Features & Integrations:
Features include machine learning, dataset views, a self-service portal, a mobile app, automated data discovery, alerts and notifications, interactive charts, and a branding toolkit.
Integrations include Amazon Advertising, Facebook, FreshService, Google Analytics, LinkedIn, Qualtrics, Salesforce, Twitter, WordPress, Zoom, and other software options.
Pros and Cons
Pros:
- Automatic notifications help you make timely decisions
- Good mobile app
- Easy to customize dashboards
Cons:
- The software may become unresponsive for a brief period when interpreting large data sets
- Some connectors are not easy to use
Grow
Best business intelligence software for dynamic data visualization
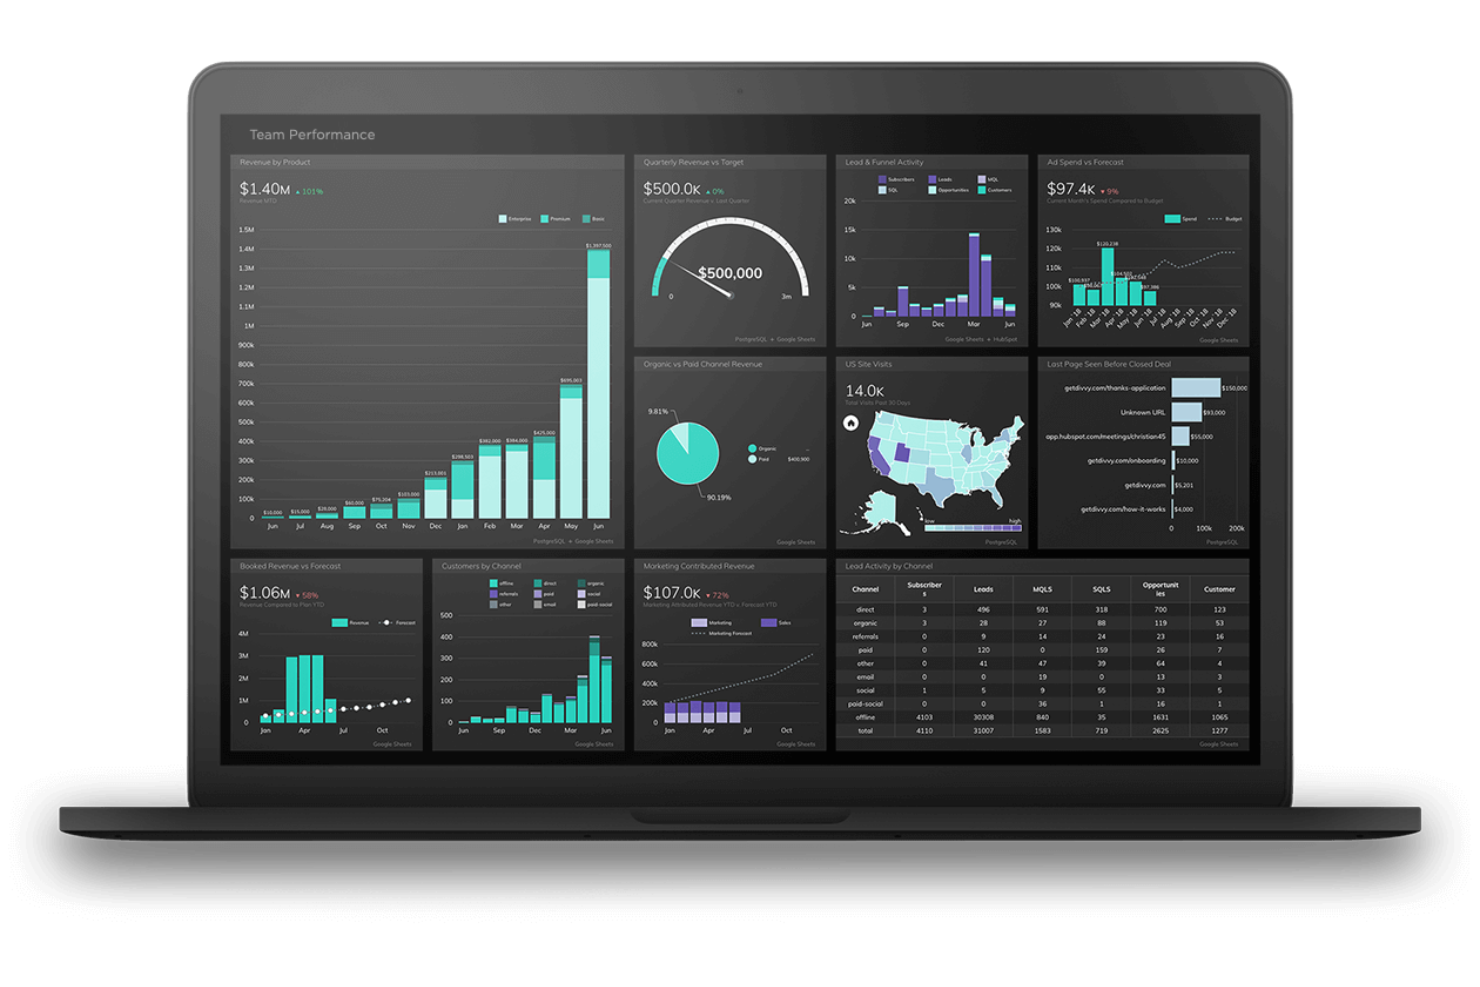
Grow.com is a business intelligence platform that streamlines data integration, visualization, and collaboration for growing organizations. It consolidates data from 150+ sources—ranging from CRMs and ad platforms to financial systems—helping teams turn fragmented data into actionable insights that drive performance and growth.
Why I picked Grow.com: Grow stands out for its accessibility and depth. The no-code interface empowers both analysts and business users to create dashboards and reports without heavy IT reliance—ideal for RevOps leaders seeking quick visibility into KPIs across marketing, sales, and finance. Its flexible ETL capabilities and SQL/non-SQL support make it suitable for both light data prep and more advanced modeling.
Standout features & integrations:
Features include dynamic, customizable dashboards, drag-and-drop ETL tools, and automated branded reporting that enhances collaboration and decision-making.
Integrations include Salesforce, HubSpot, Google Analytics, Facebook Ads, QuickBooks, and Snowflake, connecting data across key GTM and finance systems.
Pros and Cons
Pros:
- Features customizable dashboards for visualizing data effectively.
- Offers a variety of data connectors for seamless integration.
- Provides data-driven insights to enhance decision-making.
Cons:
- Some users might experience data loading speed issues with large datasets.
- Some users may find limitations in advanced analytics capabilities compared to other BI tools.

Best business intelligence software for self-service reporting
Wyn Enterprise is a business intelligence (BI) platform that enables self-service reporting and real-time data visualization for teams across industries. It combines interactive dashboards, robust data governance, and flexible deployment options to help organizations make faster, data-driven decisions.
Why I picked Wyn Enterprise: Wyn Enterprise stands out for its self-service analytics and interactive dashboards—two capabilities that empower teams to explore and interpret data without heavy IT involvement. Its flat-fee licensing model also scales cost-effectively as user demand grows, making it appealing for enterprise-wide adoption.
Standout features & integrations:
Features include interactive dashboards, self-service reporting, customizable alerts, embedded BI, data governance, and flexible deployment options for cloud or on-premises environments. These capabilities streamline reporting, enhance data accessibility, and maintain compliance across teams.
Integrations include Microsoft SQL Server, MySQL, PostgreSQL, Oracle, SAP HANA, Amazon Redshift, Google BigQuery, MongoDB, Microsoft Excel, and CSV files.
Pros and Cons
Pros:
- Provides a flat-fee licensing model that allows unlimited user scalability.
- Offers flexible deployment options for on-premises or cloud environments.
- Supports self-service reporting, allowing users to create and manage reports independently.
Cons:
- Short trial period may not be sufficient for enterprise teams to wrap their head around the tool before committing.
- Pricing information is only available upon request.

Strategy
Best business intelligence software for self-service analytics

MicroStrategy is a web-based BI tool that helps RevOps teams build self-service BI apps for their companies.
Why I picked MicroStrategy: MicroStrategy enables you to build branded analytics applications your team members can use to generate their own reports with minimal assistance. This software is great for RevOps departments that want to encourage people from other departments to handle simple data tasks by themselves.
MicroStrategy allows you to create mobile applications so your team members can perform queries on the go. You can build apps that enable other people to track their spending or billing on their own, freeing up some of your time.
MicroStrategy Standout Features & Integrations:
Features include workspace personalization, no-code or low-code app building, augmented analytics, machine-learning and automation, and data-driven insights.
Integrations include Allego Sales Enablement, FoxPlan, LoginRadius, Microsoft Word, Microsoft Excel, MindsDB, MongoDB, Salesforce, Vibe, and other software options.
Pros and Cons
Pros:
- Breaks down and interprets huge sets of data
- Easy to customize
- Dashboards look nice
Cons:
- Could offer more visualization options
- Interface looks a bit outdated

Reveal
Best for Embedded Analytics Integration

Reveal BI is a business intelligence platform that embeds analytics directly into applications for SaaS and enterprise teams. It combines AI-driven insights, customizable dashboards, and real-time data exploration to help organizations make faster, data-informed decisions without disrupting workflows.
Why I picked Reveal BI: Reveal stands out for enabling seamless embedded analytics with deep customization and strong integration flexibility. Its focus on real-time connectivity and predictive analytics helps CROs and RevOps leaders turn operational data into actionable insights inside their existing software stack—ideal for product-led organizations wanting to surface insights where users already work.
Standout features & integrations:
Features include AI-powered analytics, white-label dashboards, and drag-and-drop visualizations for instant data exploration. These capabilities simplify data presentation and support self-service analytics across departments.
Integrations include REST, Java, and JavaScript APIs, with support for data warehouses and common business systems.
Pros and Cons
Pros:
- The tool provides real-time data aggregation and drill-down capabilities for deeper insights.
- It allows quick creation of reports and dashboards with automated visualization features.
- Reveal simplifies embedding analytics, making it user-friendly for teams in finance and operations.
Cons:
- Customization options like chart types and color schemes can be limited.
- Some users note Reveal is still developing and lacks maturity in certain areas.


IBM Cognos Analytics with Watson is a business intelligence solution that enables rev teams to interpret their data with the help of artificial intelligence (AI).
Why I picked IBM Cognos Analytics with Watson: IBM Cognos Analytics with Watson stands out thanks to its proactive AI. The software’s algorithm goes through your data and helps you identify trends and patterns so you can discover insights with ease. This makes the solution very appealing to RevOps teams that need to analyze and interpret large sets of data in short time frames.
IBM Cognos Analytics with Watson is customizable, allowing you to tailor the solution to your particular needs. The software’s predictive models help you forecast future trends and outcomes, allowing you to improve your decision making process.
IBM Cognos Analytics with Watson Standout Features & Integrations:
Features include an AI assistant, predictive analytics, data modeling, decision trees, interactive reports, dynamic dashboards, and personalized reports.
Integrations include Dropbox, Facebook, Google Drive, Microsoft Excel, Microsoft Power BIOracle, Salesforce, SQL Server, Tableau, and Twitter.
Pros and Cons
Pros:
- AI processor cleans up the data for you
- Helps you detect and interpret patterns
- Handles large volumes of data smoothly
Cons:
- Learning resources are difficult to access
- Can seem overwhelming
Other Business Intelligence Software
Here are a few more options that didn’t make the best business intelligence software list:
- Oracle Analytics
Business intelligence software for enterprises
- Tableau CRM Analytics
Business intelligence software for collaborative data visualizations
- SAP BusinessObjects
Business intelligence software for data forecasting
- Qlik Sense
Business intelligence software for interactive dashboards
- Microsoft Power BI
Business intelligence software for data visualization options
- Klipfolio PowerMetrics
Business intelligence software for small teams
- Sisense
Business intelligence software for RevOps agencies
- Coefficient
For real-time data access
- Phocas
Business intelligence software for simple reporting
- Metrics Insight
Business intelligence software for data consolidation
- Slingshot
For blending BI with project workflows
- Yurbi
Business intelligence software for no-code report building


Related Business Intelligence Software Reviews
If you still haven't found what you're looking for here, check out these tools closely related to business intelligence software that we've tested and evaluated.
- CRM Software
- Sales Software
- Lead Management Software
- Contract Management Software
- Revenue Management System
- CPQ Software
How I Evaluate Business Intelligence Software
I split my evaluation into two layers: the baseline requirements a tool must clear—CRM connectivity, ad-hoc querying, and dashboards—and the differentiators that separate the best fits from the rest.
Core Functionality (Table Stakes For This List)
When I'm selecting tools for my list, I rank each one on a scale from 0 (does not offer the functionality) to 5 (excels in this area) for each core functionality listed below. Then, I calculate the tool's total score into a percentage. Each tool needs to achieve a minimum total score of 65% to be considered for inclusion.
- Data Source Connectivity: I check how many native connectors a tool offers and whether it covers the systems RevOps teams live in—CRMs like Salesforce and HubSpot, plus warehouses like Snowflake and BigQuery.
- Interactive Dashboards & Visualization: Each tool's chart library, cross-filtering, and drill-down capabilities tell me how well your team can monitor pipeline health and funnel conversion without static screenshots.
- Ad-Hoc Querying & Self-Service Analytics: I look for drag-and-drop exploration and saved queries so an ops analyst can slice win-rate data by segment or region without filing a ticket with engineering.
- Data Modeling & Transformation: Semantic layers, calculated fields, and governed metric definitions matter here—tools like Looker and Power BI handle this differently, and I evaluate how each one standardizes RevOps KPIs across teams.
- Scheduled Reporting & Alerts: I evaluate whether a platform can auto-deliver a Monday morning pipeline snapshot to Slack or email and trigger alerts when deal velocity drops below a set threshold.
- Embedded & Predictive Analytics: Forecasting, trend detection, and AI-driven insights are what I look for—features that help a CRO project quarterly revenue or flag at-risk renewals before they churn.
Once I have a list of tools that meet this criteria, I consider what sets each platform apart.
Differentiating Factors (What Sets Vendors Apart)
Here's how I compare and contrast different vendors:
Standout Features
Reverse ETL matters because insights sitting in a dashboard don't close deals—I look for tools that push data back into Salesforce or Outreach so reps act on it in their workflow. An embedded AI copilot is another differentiator, especially when an ops analyst needs a quick answer about quota attainment without building a report from scratch. I also evaluate collaborative features like in-dashboard commenting and Slack sharing, which help RevOps teams align sales and marketing around the same live data.
Beyond Features
Integration depth with the RevOps tech stack is one of the first things I evaluate—a BI tool that connects natively to your CRM, marketing automation, and data warehouse saves weeks of pipeline engineering. I also consider how licensing works when you need to scale from a five-person ops team to hundreds of dashboard viewers across sales and CS. Governance matters too; I check for row-level security and SSO support, since territory data and quota figures shouldn't be visible to everyone in the org.
How To Choose Business Intelligence Software
With so many different business intelligence software solutions available, it can be challenging to make decisions on what tool is going to be the best fit for your needs.
As you're shortlisting, trialing, and selecting business intelligence software, consider the following:
- What problem are you trying to solve - Start by identifying the business intelligence software feature gap you're trying to fill to clarify the features and functionality the tool needs to provide.
- Who will need to use it - To evaluate cost and requirements, consider who'll be using the software and how many licenses you'll need. You'll need to evaluate if it'll just be the revenue operation leaders or the whole organization that will require access. When that's clear, it's worth considering if you're prioritizing ease of use for all, or speed for your business intelligence software power users.
- What other tools it needs to work with - Clarify what tools you're replacing, what tools are staying, and the tools you'll need to integrate with, such as accounting, CRM or HR software. You'll need to decide if the tools will need to integrate together, or alternatively, if you can replace multiple tools with one consolidated business intelligence software.
- What outcomes are important - Consider the result that the software needs to deliver to be considered a success. Consider what capability you want to gain, or what you want to improve, and how you will be measuring success. For example, an outcome could be the ability to get greater visibility into performance. You could compare business intelligence software features until you’re blue in the face but if you aren’t thinking about the outcomes you want to drive, you could be wasting a lot of valuable time.
- How it would work within your organization - Consider the software selection alongside your workflows and delivery methodology. Evaluate what's working well, and the areas that are causing issues that need to be addressed. Remember every business is different — don’t assume that because a tool is popular that it'll work in your organization.
Trends In Business Intelligence Software For 2026
Business intelligence (BI) software continues to evolve rapidly, driven by the increasing need for data-driven decision-making and the strategic management of revenue operations. The latest product updates, press releases, and release logs from leading BI tools reveal key trends that are shaping the future of business intelligence. These trends reflect a broader shift towards more advanced, user-friendly, and integrated solutions designed to enhance data analysis, visualization, and the overall decision-making process. Let's explore the most notable trends in BI software that cater to the needs and challenges of revenue operation leaders.
Advanced Analytics and AI Integration
- Predictive Analytics and AI: BI tools are increasingly incorporating AI and machine learning algorithms to offer predictive analytics, automating the process of identifying trends, forecasting future outcomes, and providing recommendations for strategic decisions.
- Evidence: Introduction of features that automatically generate insights and predict customer behavior, sales trends, and market dynamics.
Enhanced Data Integration and Management
- Seamless Data Integration: The ability to integrate data from a wide array of sources, including cloud services, on-premise databases, and third-party applications, is becoming a standard feature, simplifying the data consolidation process.
- Evidence: New integrations with popular cloud platforms and business applications to enable a holistic view of organizational data.
User Experience and Accessibility
- Self-Service BI Tools: There's a growing emphasis on self-service capabilities, allowing users without technical expertise to easily create reports, dashboards, and perform data analysis, democratizing access to BI insights.
- Evidence: Development of intuitive drag-and-drop interfaces and natural language processing for querying data.
Collaborative and Mobile BI
- Enhanced Collaboration Features: BI software is focusing on improving collaboration among teams by offering shared dashboards, real-time data sharing, and commenting features, facilitating a more cohesive approach to data-driven decision-making.
- Evidence: Implementation of shared workspaces and notification systems for updates and changes to reports.
Novel Functionality
- Embedded Analytics: The integration of BI functionalities directly into business applications, providing users with insights and analytics within the context of their daily workflows, is becoming more prevalent.
- Evidence: Expansion of embedded analytics capabilities allowing third-party applications to incorporate custom BI reports and dashboards.
Declining Features
- Static Reporting: The demand for static, pre-defined reports is diminishing in favor of dynamic, interactive reports that users can customize and explore based on their specific needs and questions.
- Evidence: Shift towards interactive visualizations and ad-hoc reporting tools.
These trends indicate a significant move towards making BI tools more intelligent, integrated, and user-friendly, with a strong emphasis on supporting revenue operations through enhanced data analysis, predictive insights, and collaborative decision-making. As the BI landscape continues to evolve, revenue operation leaders should focus on selecting tools that align with these trends to maximize their organization's ability to analyze data effectively, make informed decisions, and drive strategic growth.
What is Business Intelligence Software?
Business intelligence software is a set of tools for analyzing business data. It helps in collecting, processing, and transforming data into actionable insights through reporting, visualization, and analytics. This software supports decision-making by aggregating data from multiple sources and presenting it in an understandable format.
The benefits of business intelligence software include improved decision-making processes, increased operational efficiency, and better understanding of market trends. It aids businesses in identifying growth opportunities, optimizing processes, and gaining competitive advantage through informed strategies. By leveraging data effectively, companies can make proactive, knowledge-driven decisions.
Features Of Business Intelligence Software
When selecting business intelligence software, keep an eye out for the following key features:
- Data integration: Pull together information from multiple sources—like spreadsheets, databases, or cloud apps—so you get a unified view of your business without manual data mishmash.
- Interactive dashboards: Present complex data in easy-to-understand, customizable visual formats that let you drill down and manipulate the info you care about most.
- Advanced reporting: Generate detailed, flexible reports on demand, whether you need a high-level overview or a deep dive into specific KPIs.
- Real-time analytics: Access up-to-the-minute insights so you can react quickly to changes and opportunities in your business as they happen, not after the fact.
- Data visualization: Turn your numbers into compelling charts, graphs, and heatmaps, making it much easier to spot trends and outliers (no spreadsheet headaches required).
- Collaboration tools: Let team members share dashboards, annotate reports, or work side-by-side on analyses—even if you’re on different corners of the globe.
- Role-based access controls: Choose exactly who gets to see or edit certain data, keeping your important info secure while freeing your team to do their best work.
- Mobile accessibility: Stay in the know and make decisions on the fly with full access to your insights from your phone or tablet.
- Data cleansing and preparation: Clean up messy or inconsistent information automatically before your analysis starts, saving you tons of time and ensuring accuracy.
- Scalability: Ensure your business intelligence software can grow with you, handling more users and larger datasets as your company expands.
Common Business Intelligence Software AI Features
Beyond the standard business intelligence software features listed above, many of these solutions are incorporating AI with features like:
- Sentiment analysis: Analyze text data from sources like surveys or social media so you can understand how customers or employees really feel—without sifting through every comment manually.
- Predictive analytics: Use machine learning to forecast future trends, helping you plan with confidence instead of just reacting to what already happened.
- Natural language querying: Let you ask questions about your data in plain English and instantly get understandable answers—no coding or technical jargon required.
- Automated insights: Surface actionable recommendations or significant data anomalies automatically, so you don’t have to dig for every hidden gem yourself.
- Anomaly detection: Spot unusual patterns or outliers in real time, alerting you to potential problems or unexpected opportunities right away.
- AI-powered data preparation: Streamline the tedious work of cleaning, categorizing, and blending data by letting algorithms handle it swiftly and accurately.
Benefits Of Business Intelligence Software
Business intelligence (BI) software plays a pivotal role in transforming data into actionable insights that drive strategic decisions and enhance operational efficiency. For organizations looking to optimize their revenue operations, BI software offers a suite of tools designed to analyze, visualize, and leverage data effectively. Here are five primary benefits that BI software provides to users and organizations, especially those in the realm of revenue operations management.
- Data-Driven Decision Making: Empowers organizations with data-backed insights. This benefit allows users to make informed strategic decisions, reducing guesswork and enhancing the precision of business strategies aimed at revenue growth.
- Enhanced Operational Efficiency: Streamlines and automates data analysis processes. By automating routine data processing tasks, organizations can allocate resources more effectively, focusing on strategic activities that directly contribute to revenue generation.
- Improved Customer Insights: Delivers a deeper understanding of customer behavior and preferences. This insight enables businesses to tailor their offerings and marketing strategies to meet customer needs more effectively, leading to increased satisfaction and loyalty.
- Competitive Advantage: Provides a competitive edge through access to real-time business insights. Staying ahead of market trends and competitor strategies allows businesses to adapt quickly, seizing opportunities and mitigating risks more effectively.
- Increased Revenue Growth: Identifies opportunities for revenue optimization and cost reduction. By highlighting areas where efficiencies can be gained and new revenue streams can be developed, BI software plays a direct role in driving revenue growth and profitability.
Costs & Pricing for Business Intelligence Software
Business intelligence (BI) software is crucial for organizations looking to leverage data for strategic decision-making. BI tools vary widely in functionality, scalability, and price, catering to businesses of all sizes across various industries. From solutions designed for small teams just starting with data analytics to comprehensive platforms for enterprise-level insights, understanding the range of plan options and their pricing is key to selecting a BI tool that aligns with your organization's needs and budget.
Plan Comparison Table for Business Intelligence Software
| Plan Type | Average Price | Common Features Included | Best For |
| Free | $0 | - Basic data visualization - Limited data sources integration - Basic reporting capabilities | Individuals or small teams just starting with BI tools |
| Starter | $10 - $25 per user/month | - Enhanced data visualization - More data source integrations - Customizable dashboards - Basic sharing capabilities | Small to medium-sized businesses needing more robust BI tools |
| Professional | $50 - $100 per user/month | - Advanced analytics - Broader data source integration - Collaboration tools - More extensive customization options | Growing businesses that require advanced analytics and collaboration |
| Enterprise | $100+ per user/month | - Comprehensive analytics suite - Full data integration - Advanced security features - Dedicated support - Scalability options | Large enterprises needing comprehensive BI solutions and scalability |
When considering which BI software plan to choose, it's important to assess both your immediate analytics needs and your long-term data strategy. Opt for a plan that not only fits your current budget but also offers the flexibility to scale as your organization's data analytics capabilities grow. Balancing cost against the potential for actionable insights will ensure you make a choice that drives value and supports informed decision-making across your organization.
Business Intelligence Software Frequently Asked Questions
If your team is considering working with a business intelligence software platform, you likely have some questions before getting started. Let’s take a look at some of the FAQs about BI software.
What key metrics should BI software track for revenue growth?
How does BI software integrate with CRM and other tools in the tech stack?
How can BI software help with sales forecasting and pipeline management?
What are the top features to look for in BI software?
How much does BI software cost for small and medium-sized businesses?
Additional RevOps Software
Here are some other software options you might want to consider.
- Best Sales Software
- Free CRM Software
- Customer Management Software
- Data Visualization Software
- Predictive Analytics Software
- Sales Forecasting Software
- Sales Reporting Software
- Sales Intelligence Software
- Revenue Management Systems
- KPI Software
- Sales Tracking Software
Conclusion
Choosing the right business intelligence software is crucial for any organization looking to make the most of its data. These tools enable businesses to analyze information effectively, leading to better decision-making, improved operational efficiency, and increased competitiveness. By harnessing the power of data, businesses can streamline processes, identify growth opportunities, and maintain an edge in their industry. I hope this list helped you find some great BI tool options for your team.
Before you go, don’t forget to subscribe to our RevOps newsletter to receive actionable advice from industry leaders directly in your inbox.