12 Migliori Alternative a Looker per il 2026

Shortlist di alternative a Looker


Una valida alternativa a Looker offre al tuo team una modellazione dei dati flessibile, una visualizzazione dei dati intuitiva e un'integrazione affidabile con il tuo stack esistente. Se sei alla ricerca delle migliori alternative a Looker, probabilmente stai valutando fattori come il costo, la scalabilità o funzionalità di analisi specifiche che si adattano meglio alle esigenze di business intelligence e analisi dati della tua azienda. Molte squadre cercano anche strumenti capaci di gestire dati complessi, supportare diversi formati di report e offrire funzioni di previsione, riducendo al minimo la curva di apprendimento. Questa lista ti aiuterà a confrontare le principali piattaforme BI e di analisi — comprese le opzioni simili a Looker Studio — così potrai scegliere con sicurezza una soluzione che risponda alla tua strategia dati, ai flussi di lavoro sui report e ai tuoi piani di crescita.
Cos'è Looker?
Looker è uno strumento di business intelligence e una piattaforma di analisi dati che aiuta i team a esplorare, analizzare e visualizzare dati provenienti da più fonti. Offre un livello di modellazione chiamato LookML, che consente agli utenti di definire metriche e relazioni per report coerenti. Looker supporta dashboard personalizzate, report interattivi e si integra con i data warehouse in cloud, rendendolo una scelta popolare per le organizzazioni che gestiscono grandi volumi di dati. Grazie alle sue funzionalità avanzate e alla sua interfaccia relativamente intuitiva, Looker contribuisce a migliorare l'esperienza utente complessiva supportando decisioni basate sui dati e analisi centralizzate, scalabili e governate.
Perché Fidarsi delle Nostre Recensioni Software
Testiamo e recensiamo software RevOps dal 2022. In quanto leader RevOps, sappiamo quanto sia fondamentale (e difficile) scegliere il software giusto. Investiamo in ricerche approfondite per aiutare il nostro pubblico a prendere decisioni più consapevoli nell’acquisto di software. Abbiamo testato oltre 2.000 strumenti per diversi casi d’uso RevOps e abbiamo scritto più di 1.000 recensioni dettagliate.Scopri come manteniamo la trasparenza & la nostra metodologia di valutazione dei software.
Riepilogo delle migliori alternative a Looker
Questa tabella comparativa riassume i dettagli sui prezzi delle mie principali scelte di alternative a Looker per aiutarti a trovare quella più adatta al tuo budget e alle esigenze della tua azienda.
| Tool | Best For | Trial Info | Price | ||
|---|---|---|---|---|---|
| 1 | Best for interactive visual analytics | Free plan available | From $15/user/month (billed annually) | Website | |
| 2 | Best for automated data pipeline workflows | 14-day free trial + free demo available | From $800/10 users/month (billed biennially) | Website | |
| 3 | Best for collaborative SQL analytics | Free trial + free demo available | From $25/user/month (billed annually) | Website | |
| 4 | Best for real-time data dashboards | 30-day free trial + free demo available | Pricing upon request | Website | |
| 5 | Best for open-source self-service reporting | Free plan available | From $100/month (billed monthly) + $6/user/month | Website | |
| 6 | Best for embedded analytics in applications | Free plan available | Pricing upon request | Website | |
| 7 | Best for search-driven data exploration | 14-day free trial + free demo available | From $25/user/month (billed annually) | Website | |
| 8 | Best for spreadsheet-style cloud analytics | Free demo available | Pricing upon request | Website | |
| 9 | Best with Microsoft 365 integration | Free trial + free plan available | From $14/user/month (billed annually) | Website | |
| 10 | Best for customizable open-source dashboards | Free forever | Free forever | Website |
-

Prisync
Visit WebsiteThis is an aggregated rating for this tool including ratings from Crozdesk users and ratings from other sites.4.7 -
Expedite Commerce
Visit Website -
QuickBooks Online
Visit WebsiteThis is an aggregated rating for this tool including ratings from Crozdesk users and ratings from other sites.4


Recensioni sulle alternative a Looker
Di seguito trovi i miei riassunti dettagliati delle alternative a Looker che sono entrate nella mia shortlist. Le mie recensioni offrono uno sguardo approfondito su funzionalità, integrazioni e casi d’uso ideali di ogni piattaforma per aiutarti a trovare la soluzione migliore per la tua azienda.
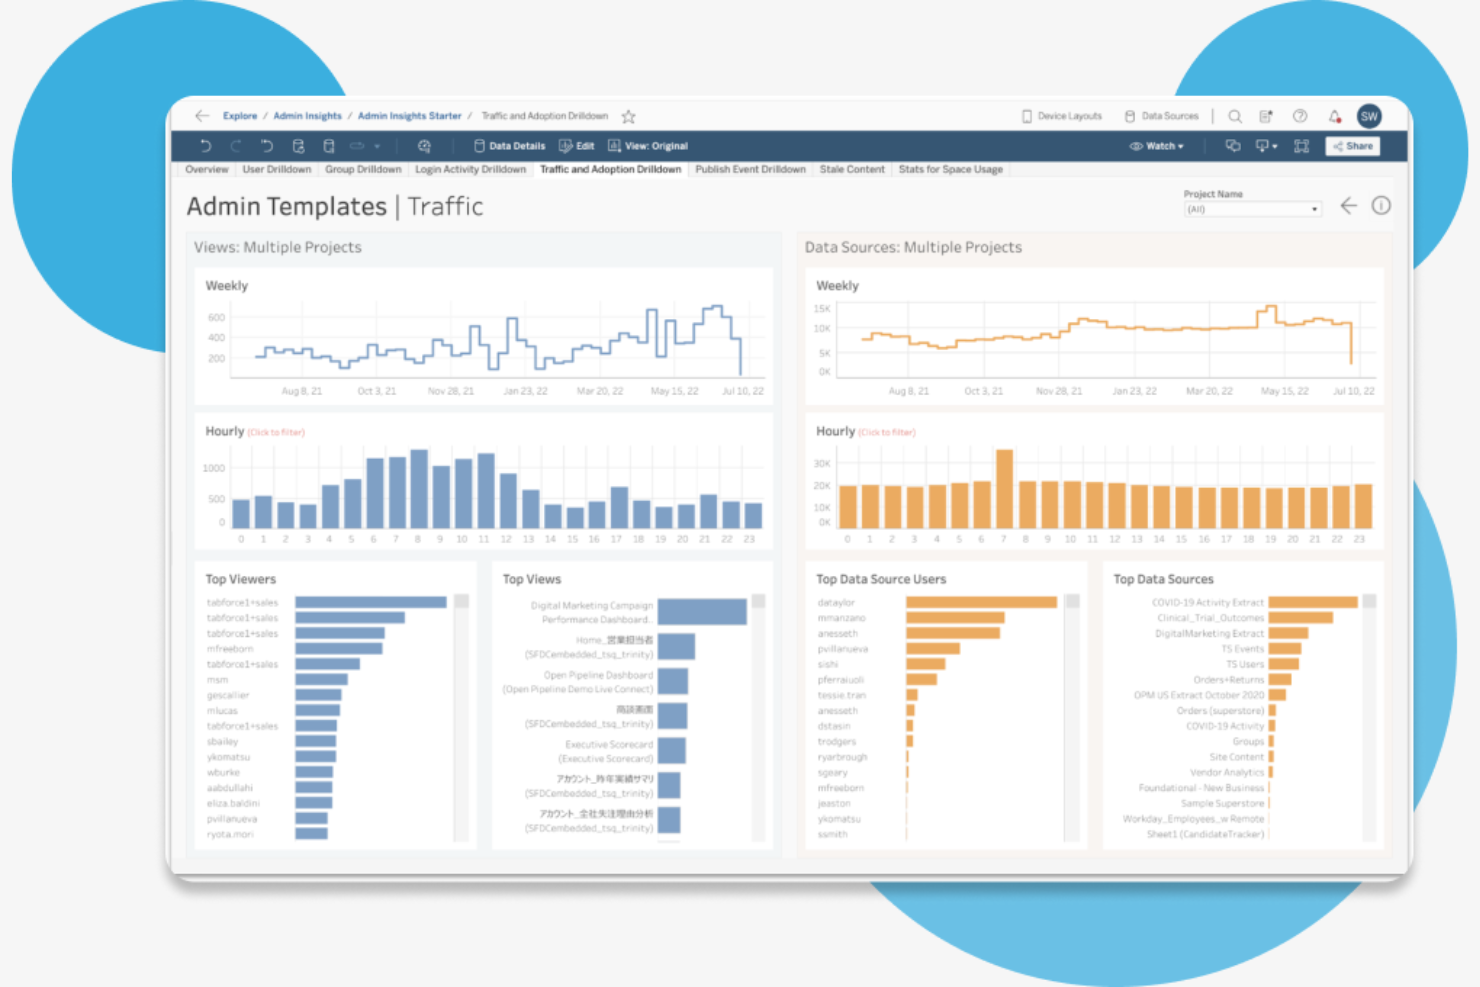
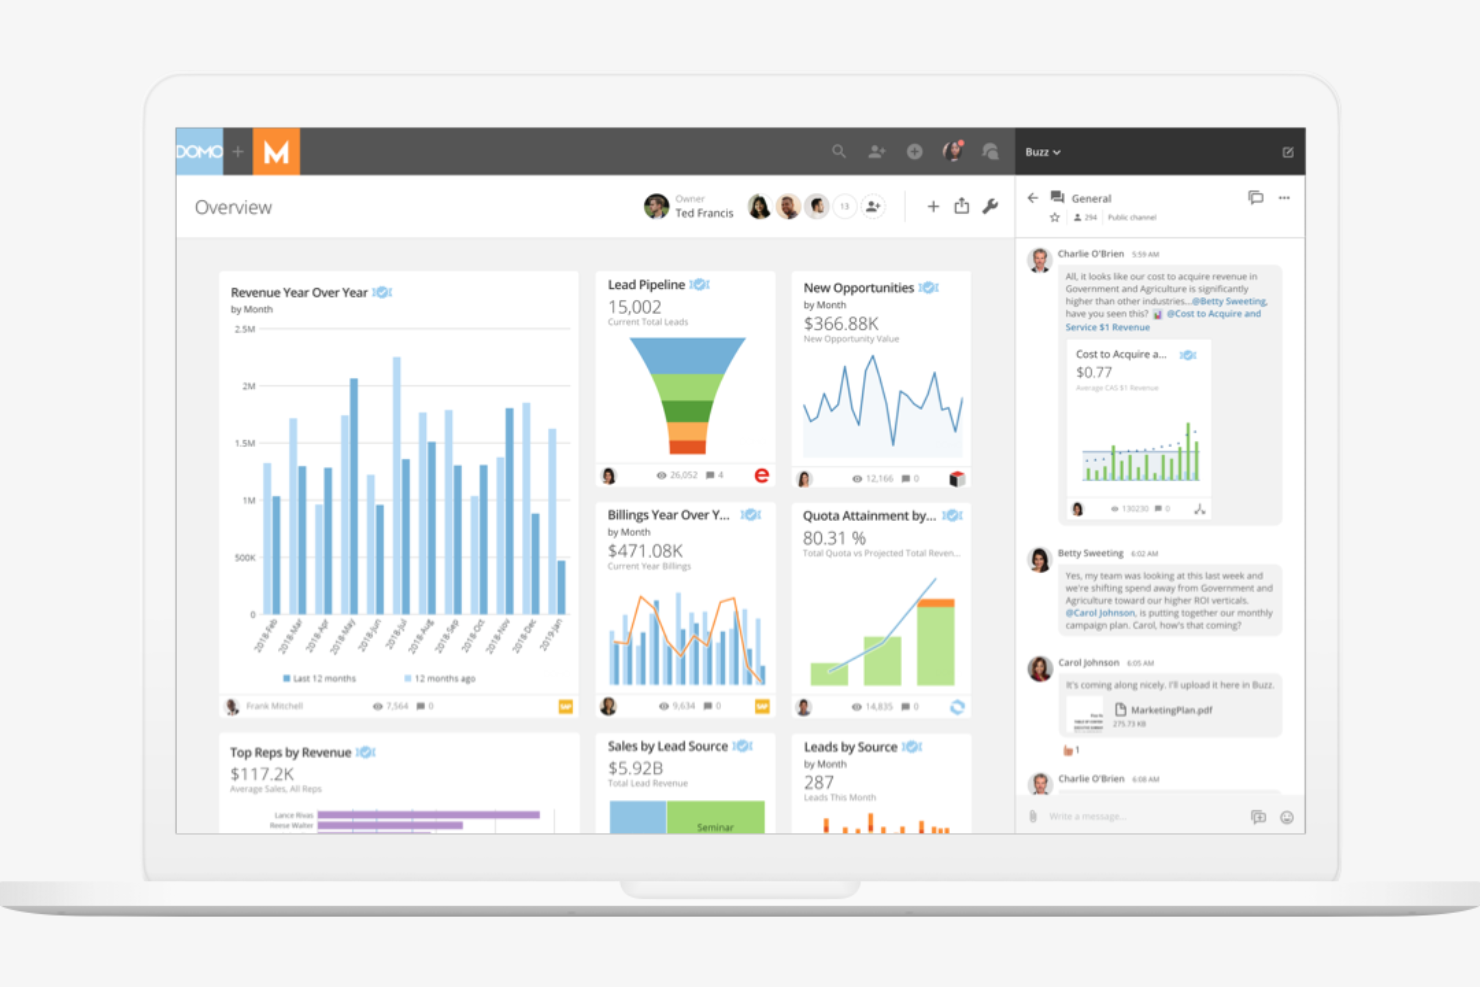
Tableau stands out for teams that need highly interactive and visually rich analytics. It’s a strong fit for data analysts and business users who want to build custom dashboards and explore data with drag-and-drop tools. Tableau’s visual approach helps organizations uncover trends and insights that might be harder to spot in more code-driven platforms like Looker.
Why Tableau Is a Good Looker Alternative
Tableau offers a level of interactive visual analytics that’s hard to match in other platforms. I picked Tableau for its dynamic dashboard capabilities, which let users filter, drill down, and manipulate data in real time. Its drag-and-drop interface makes it easy to build complex visualizations without writing code. For teams that prioritize visual exploration and storytelling with data, Tableau provides a flexible and engaging alternative to Looker’s more model-driven approach.
Tableau Key Features
Some other features in Tableau that are useful for business intelligence and analytics teams include:
- Data Prep with Tableau Prep: Prepare, clean, and shape data visually before analysis using a dedicated data preparation tool.
- Live and In-Memory Data Connections: Connect to data in real time or use in-memory extracts for faster performance and flexibility.
- Advanced Calculations: Build custom calculations and statistical models directly within dashboards using a formula editor.
- Mobile-Optimized Dashboards: Design dashboards that automatically adjust for mobile devices, making analytics accessible on the go.
Tableau Integrations
Integrations include Salesforce CRM, Snowflake, Google BigQuery, Amazon Redshift, Microsoft SQL Server, SAP HANA, Google Cloud, Databricks, and more.
Pros and Cons
Pros:
- Flexible sharing and publishing options
- Extensive library of pre-built data connectors
- Strong support for real-time data connections
Cons:
- No built-in data transformation scripting
- Limited version control for dashboard changes
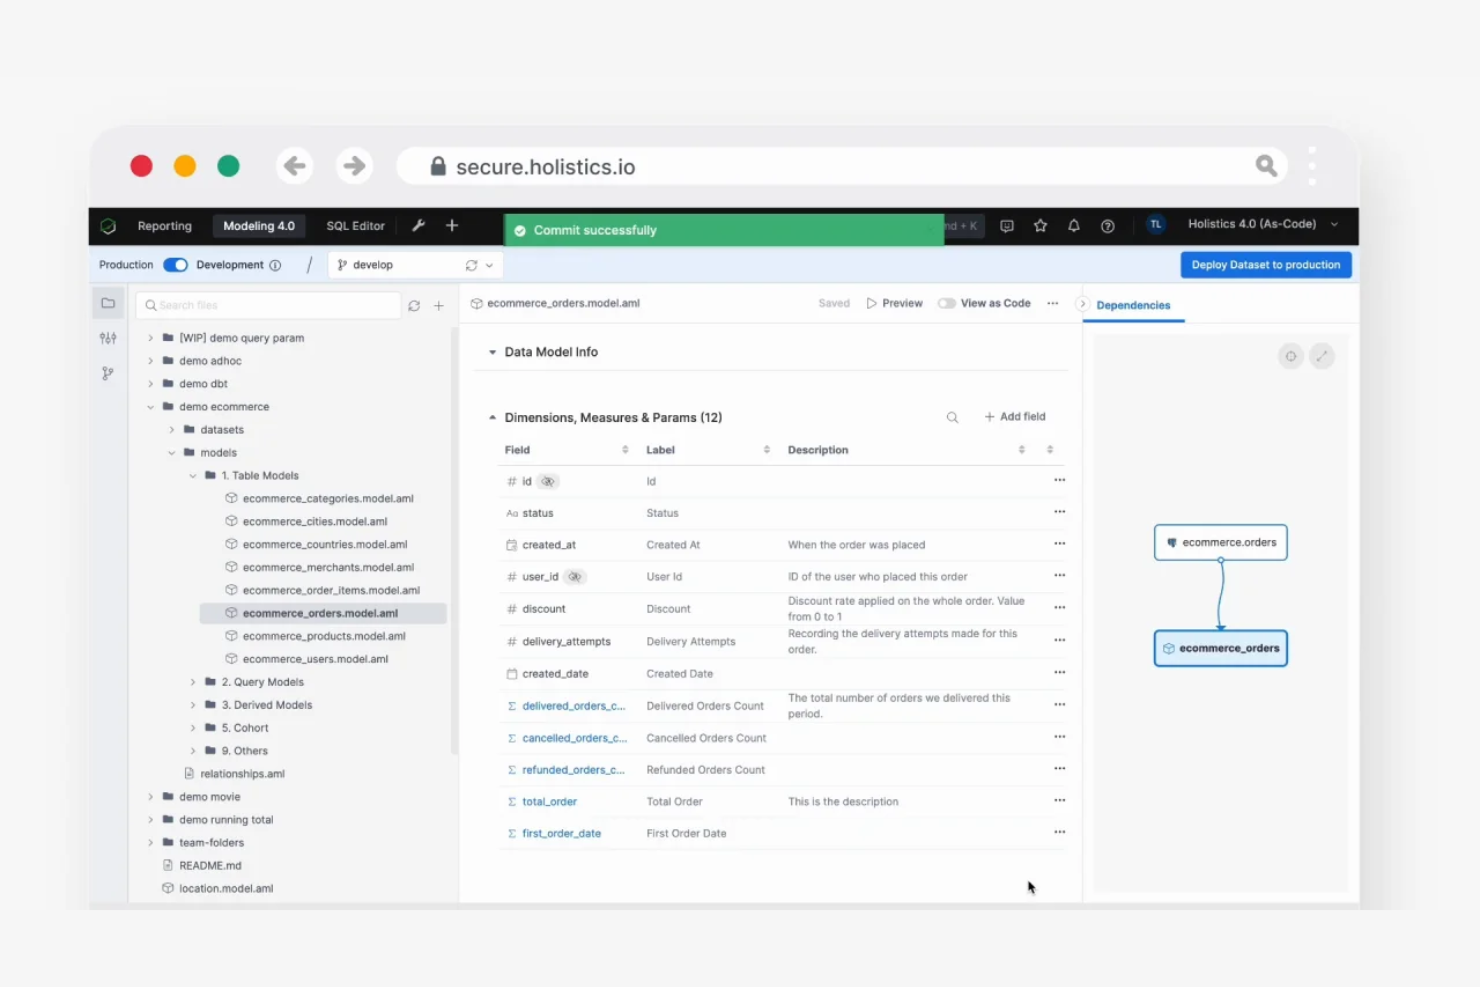
Holistics is built for data teams that want to automate and manage data pipeline workflows without heavy engineering resources. It appeals to analytics professionals and operations leaders who need to model, transform, and deliver data across teams with minimal manual intervention. The platform’s code-based modeling and automated scheduling set it apart from Looker by giving users more control over data preparation and delivery.
Why Holistics Is a Good Looker Alternative
Unlike Looker, Holistics puts automated data pipeline workflows at the center of its platform. I picked Holistics because it lets you define data models and transformation logic using code, then schedule and orchestrate those workflows without relying on external tools. The platform’s data modeling layer supports reusable logic and version control, making it easier to manage complex analytics projects. If you want to automate data prep and delivery as part of your business intelligence process, Holistics gives you more flexibility and control than most traditional BI tools.
Holistics Key Features
Some other features in Holistics that are useful for analytics teams include:
- Self-Service Reporting: Business users can explore and build their own reports without writing SQL.
- Data Alerts: Set up automated notifications based on data thresholds or anomalies.
- White-Labeling: Customize dashboards and reports with your company’s branding.
- Row-Level Security: Control data access for different users or groups within your organization.
Holistics Integrations
Native integrations are not currently listed.
Pros and Cons
Pros:
- Data alerts notify users of anomalies instantly
- White-labeling for branded dashboards and reports
- Self-service reporting for non-technical users
Cons:
- No built-in semantic layer for business logic
- No drag-and-drop dashboard builder available
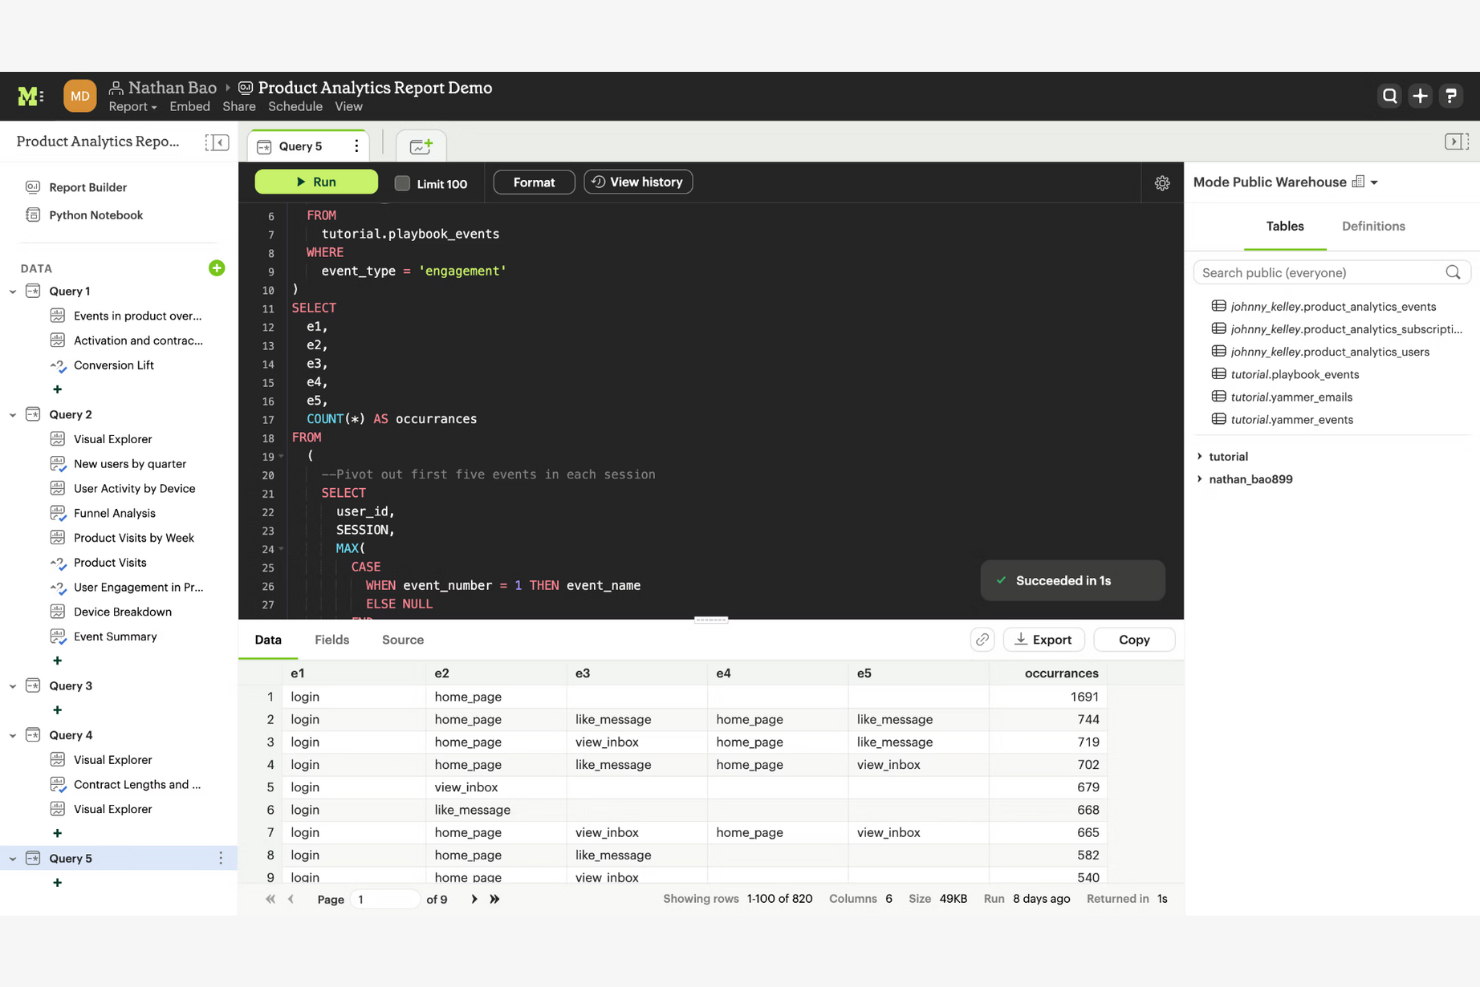
Data teams that prioritize collaboration and SQL-driven analysis often choose Mode for their analytics workflows. Mode is designed for analysts and business users who need to work together on queries, reports, and dashboards in real time. Its focus on shared SQL workspaces and integrated Python and R notebooks makes it a strong fit for organizations that want to blend code-based analytics with interactive business intelligence.
Why Mode Is a Good Looker Alternative
For teams that need to collaborate on SQL analytics, Mode offers a different approach than Looker. I picked Mode because it lets multiple users write, edit, and share SQL queries in real time, making it easy to build and refine analyses as a group. The platform also supports integrated Python and R notebooks, so you can extend your SQL work with advanced analytics and visualizations. If your team values hands-on, code-driven collaboration, Mode provides a flexible environment that supports both technical and business users.
Mode Key Features
Some other features in Mode that are valuable for analytics teams include:
- Report Scheduling: Automate the delivery of reports to stakeholders on a recurring basis.
- Drag-and-Drop Visualization Builder: Create charts and dashboards without writing code.
- Data Source Connections: Connect directly to cloud data warehouses like Snowflake, Redshift, and BigQuery.
- Version History: Track changes and revert to previous versions of reports and queries.
Mode Integrations
Integrations include Amazon Redshift, Snowflake, Google BigQuery, Databricks, Microsoft SQL Server, PostgreSQL, MySQL, Oracle, Presto, and Slack.
Pros and Cons
Pros:
- Version history tracks all report changes
- Integrated Python and R notebooks for analysis
- Real-time SQL collaboration for multiple users
Cons:
- No native embedded analytics for external apps
- Requires SQL knowledge for most workflows
When you need live, always-up-to-date dashboards, Domo is built to deliver. Domo is a strong fit for operations, sales, and marketing teams that rely on real-time data to make fast decisions. Its streaming data connectors and auto-refreshing dashboards help you monitor business performance minute by minute, without manual updates.
Why Domo Is a Good Looker Alternative
Unlike Looker, Domo is purpose-built for teams that need real-time visibility into their data. I picked Domo because its streaming data connectors and auto-refreshing dashboards let you see up-to-the-minute changes without manual intervention. Domo’s alerting system also notifies you instantly when key metrics cross thresholds, so you can act quickly. If your business depends on live data to drive decisions, Domo’s real-time dashboard capabilities set it apart.
Domo Key Features
Some other features in Domo that are useful for analytics teams include:
- Magic ETL Data Pipeline: Build and automate data transformation workflows with a drag-and-drop interface.
- App Studio: Create custom data apps and visualizations tailored to your business needs.
- Mobile Access: View and interact with dashboards and reports from any mobile device.
- Data Governance Tools: Manage permissions, data lineage, and compliance across your organization.
Domo Integrations
Integrations include Snowflake, Databricks, Amazon Redshift, BigQuery, Oracle NSAW, and more.
Pros and Cons
Pros:
- App Studio for building custom data apps
- Extensive library of prebuilt data connectors
- Magic ETL for visual data transformation
Cons:
- Limited support for on-premises data sources
- Dataflow versioning can be difficult to manage
Open-source teams looking for self-service analytics often turn to Metabase for its flexibility and transparency. Metabase appeals to organizations that want to host their own BI platform and customize reporting without vendor lock-in. Its open-source foundation and intuitive query builder make it easy for non-technical users to explore data and create dashboards on their own terms.
Why Metabase Is a Good Looker Alternative
Unlike many proprietary BI tools, Metabase gives you full control through its open-source model, making it a strong choice for teams that want to self-host and customize their analytics environment. I picked Metabase because it lets you modify the source code, tailor the platform to your organization’s needs, and avoid vendor lock-in. Its visual query builder allows non-technical users to create and share reports without writing SQL. For businesses that value transparency and flexibility in their analytics stack, Metabase offers a unique alternative to Looker.
Metabase Key Features
Some other features in Metabase that are useful for analytics teams include:
- Automated Dashboard Subscriptions: Schedule dashboards to be delivered to users’ inboxes on a recurring basis.
- Data Model Editor: Define and manage metadata, relationships, and field descriptions directly within the platform.
- Audit Logs: Track user activity and changes to questions, dashboards, and settings for compliance and troubleshooting.
- Embedded Analytics: Integrate interactive charts and dashboards into your own applications or customer portals.
Metabase Integrations
Integrations include Amazon Redshift, BigQuery, Snowflake, Databricks, PostgreSQL, MySQL, Microsoft SQL Server, MongoDB, Google Sheets, and Amazon Athena.
Pros and Cons
Pros:
- Visual query builder for non-technical users
- Self-hosting option for data privacy needs
- Open-source codebase for full platform control
Cons:
- Audit logging only available on paid plans
- No built-in support for LookML modeling
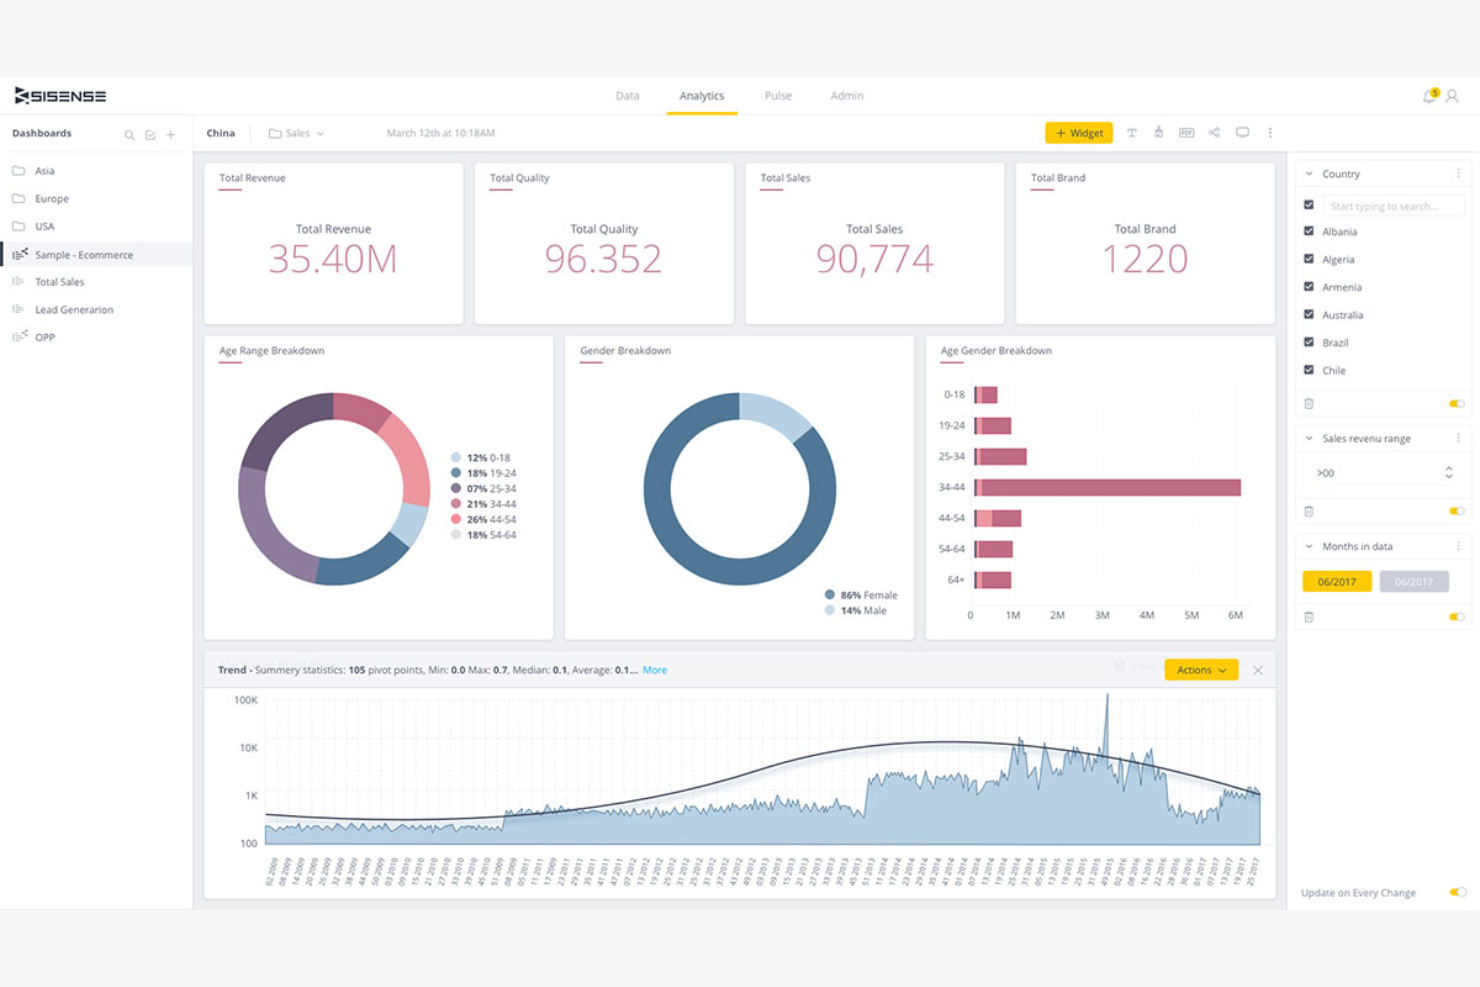
If you need to embed analytics directly into your product or customer-facing applications, Sisense is built for that purpose. Sisense appeals to SaaS companies and software teams that want to deliver interactive dashboards and analytics as part of their own platforms. Its flexible APIs and white-labeling options help you create a smooth analytics experience for your users without sending them to a separate BI tool.
Why Sisense Is a Good Looker Alternative
For teams focused on embedding analytics into their own products, Sisense offers a level of flexibility that Looker doesn’t match. I picked Sisense because it provides a full suite of APIs and SDKs for embedding dashboards, widgets, and even custom analytics workflows directly into web applications. Its white-labeling capabilities let you fully brand the analytics experience as your own, which is essential for SaaS and product teams. If you want to deliver analytics as a part of your platform, Sisense is purpose-built for that use case.
Sisense Key Features
Some other features in Sisense that are valuable for analytics teams include:
- Elasticube Data Engine: Build and manage high-performance data models for fast querying and analysis.
- AI-Driven Insights: Surface automated data trends and anomaly detection using built-in machine learning.
- Role-Based Access Controls: Set granular permissions for users, groups, and data assets.
- Scheduled Reporting: Automate the delivery of dashboards and reports to stakeholders on a recurring schedule.
Sisense Integrations
Integrations include Snowflake, Amazon Redshift, Google BigQuery, Azure Synapse, Salesforce, Google Analytics, PostgreSQL, MySQL, Microsoft SQL Server, and Oracle.
Pros and Cons
Pros:
- Handles large data sets
- Customizable dashboards
- Fast data processing
Cons:
- Can be resource-intensive
- Limited advanced analytics features
If you want to analyze data using natural language search, ThoughtSpot is designed for that experience. This cloud-native platform is a strong fit for business teams, analysts, and startups that need quick, self-serve answers from complex datasets without relying on technical experts. Its search-driven analytics let you type questions and instantly generate charts using built-in visualization tools. With strong analytics capabilities and integrations with data preparation tools like Power Query, ThoughtSpot helps teams explore and model data without needing a dedicated modeling language.
Why ThoughtSpot Is a Good Looker Alternative
For teams that want to explore data by asking questions in plain language, ThoughtSpot offers a unique approach compared to Looker. I picked ThoughtSpot because its search-driven analytics let you type queries and instantly generate visualizations, removing the need for complex report building. The platform’s AI-powered search suggestions help guide users to relevant insights, even if they’re not sure how to phrase their questions. If you want a tool that makes data exploration as simple as searching the web, ThoughtSpot is a strong alternative.
ThoughtSpot Key Features
Some other features in ThoughtSpot that are valuable for analytics teams include:
- Liveboard Dashboards: Create interactive, real-time dashboards that update as your data changes.
- SpotIQ AI Insights: Automatically surface trends and anomalies in your data using AI-driven analysis.
- Data Modeling Layer: Define relationships, hierarchies, and custom metrics directly within the platform.
- Embedded Analytics: Integrate search-driven analytics and visualizations into your own apps or portals.
ThoughtSpot Integrations
Integrations include GitHub, Google Sheets, Webhooks, and more.
Pros and Cons
Pros:
- Embedded analytics for custom app experiences
- Liveboard dashboards update with real-time data
- Natural language search for instant data queries
Cons:
- Exporting visualizations can be restrictive
- Data modeling options are less granular
Sigma brings spreadsheet-style analytics to the cloud, making it a strong fit for teams that rely on Excel but need enterprise-grade data access. It’s especially useful for business analysts and operations teams who want to work with live data using familiar spreadsheet formulas and logic. Unlike Looker, Sigma lets users analyze and visualize data directly from cloud data warehouses without writing SQL.
Why Sigma Is a Good Looker Alternative
For teams that want spreadsheet-style analytics in the cloud, Sigma offers a unique approach compared to Looker. I picked Sigma because it lets users interact with live data using familiar spreadsheet formulas and logic, without needing to write SQL. The platform’s visual data exploration and formula builder make it easy for business users to analyze large datasets directly from cloud data warehouses. If your team is comfortable with spreadsheets but needs scalable, governed analytics, Sigma bridges that gap in a way Looker doesn’t.
Sigma Key Features
Some other features in Sigma that are valuable for analytics teams include:
- Collaboration Tools: Multiple users can comment and work together on the same analysis in real time.
- Data Governance Controls: Admins can manage permissions and data access at a granular level.
- Embedded Analytics: Teams can embed dashboards and reports into external applications or portals.
- Audit Logs: Track user activity and changes for compliance and transparency.
Sigma Integrations
Integrations include Snowflake, Databricks, AWS, Azure, Google Cloud, and more.
Pros and Cons
Pros:
- Built-in audit logs for compliance tracking
- No SQL required for data exploration
- Direct connection to cloud data warehouses
Cons:
- No on-premises deployment option offered
- Limited advanced charting options available
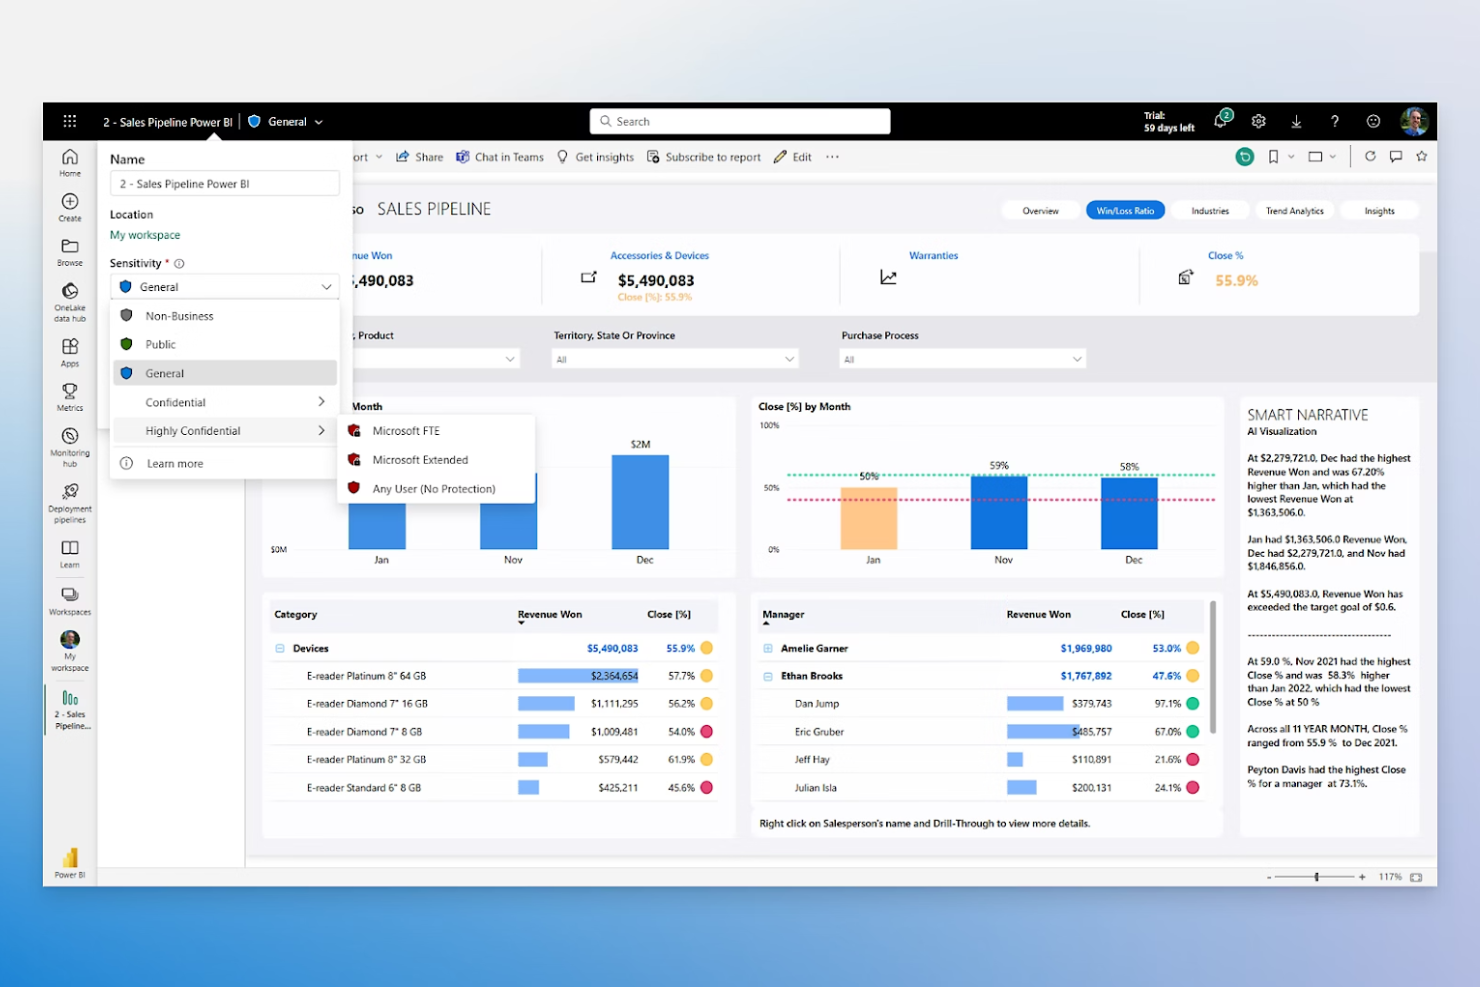
If your team relies on Microsoft 365, Power BI offers a natural fit for business intelligence and analytics. It’s especially useful for organizations that want to connect Excel, Teams, and SharePoint data directly into interactive dashboards. Power BI stands out for its deep integration with Microsoft’s ecosystem, making it easier to unify reporting and collaboration across familiar tools.
Why Power BI Is a Good Looker Alternative
For teams already invested in Microsoft 365, Power BI offers a level of integration that Looker can’t match. I picked Power BI because it lets you embed reports directly into Microsoft Teams and SharePoint, making analytics part of your daily workflow. Its ability to pull live data from Excel and other Microsoft apps simplifies reporting and collaboration. If your business depends on Microsoft’s productivity suite, Power BI brings analytics and business intelligence closer to where your team already works.
Power BI Key Features
Some other features in Power BI that are valuable for analytics teams include:
- AI-Powered Data Insights: Use built-in artificial intelligence to detect patterns and generate insights from your data.
- Custom Visual Marketplace: Access a library of custom visuals created by Microsoft and the Power BI community to improve your reports.
- Row-Level Security: Set granular permissions to control which users can view specific data within dashboards and reports.
- Scheduled Data Refresh: Automate data updates from connected sources to keep dashboards current without manual intervention.
Power BI Integrations
Integrations include Microsoft Excel, Microsoft Teams, SharePoint, Azure SQL Database, Databricks, and more.
Pros and Cons
Pros:
- Row-level security for granular data access
- Extensive library of custom visualizations
- Built-in AI features for automated insights
Cons:
- Data modeling less flexible than LookML
- Limited support for non-Microsoft data sources
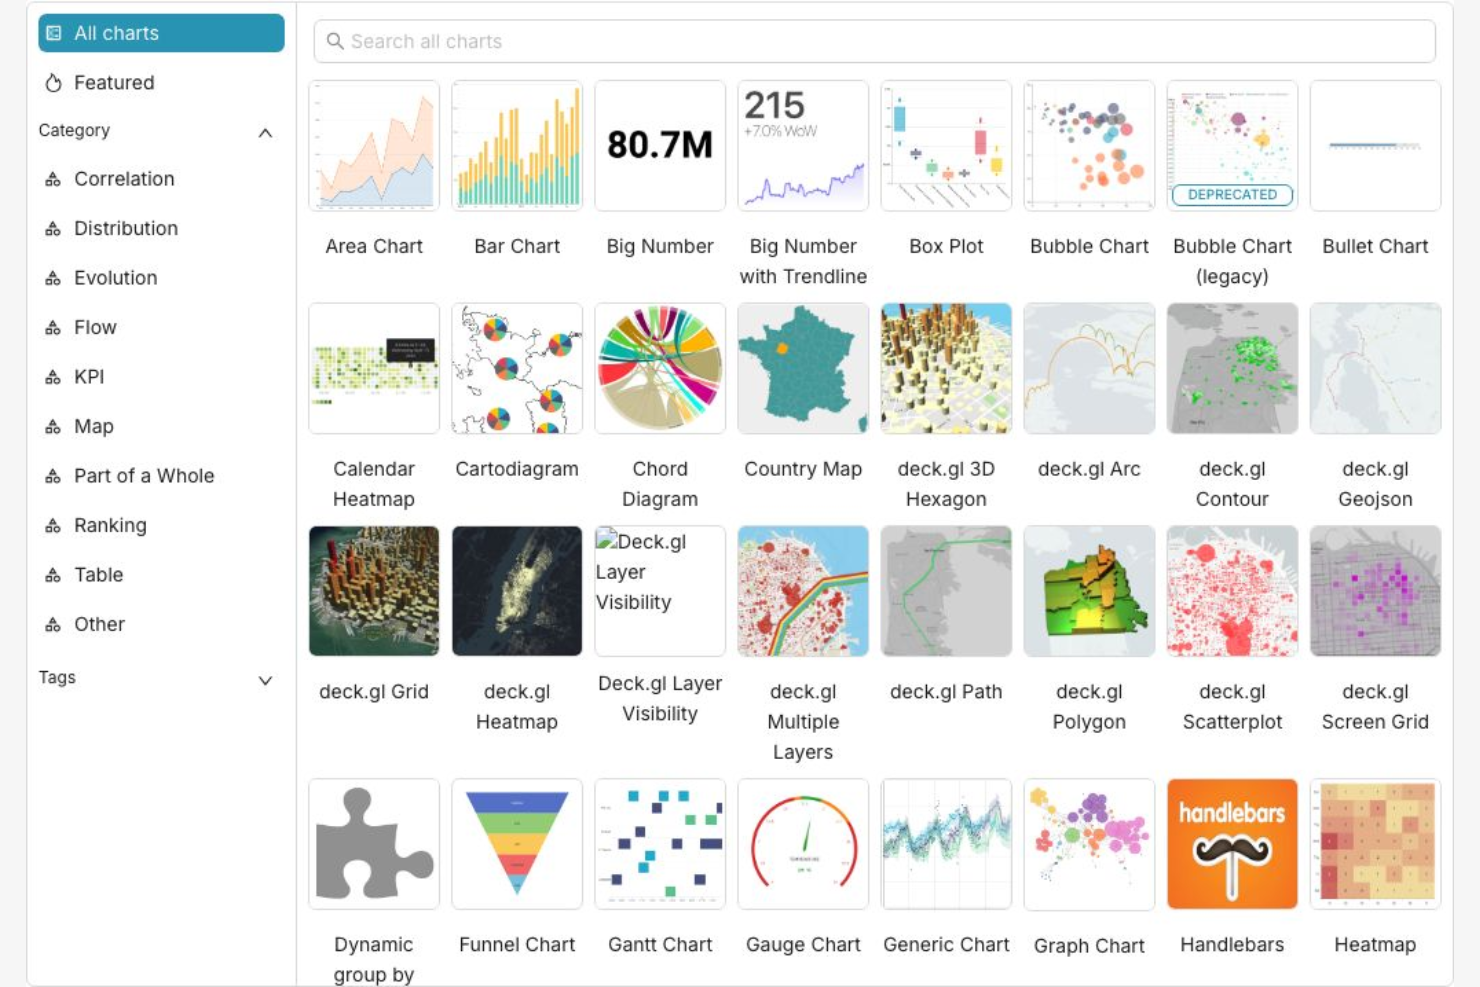
Open-source teams and organizations looking for deep dashboard customization often turn to Apache Superset. This platform appeals to data engineers and analysts who want full control over their analytics environment, from data connections to visualization design. Superset stands out for its flexible architecture, allowing you to tailor dashboards and workflows to fit unique business needs.
Why Apache Superset Is a Good Looker Alternative
If you want a business intelligence platform that you can fully customize, Apache Superset is worth considering as a Looker alternative. I picked Superset because it’s open-source, so you can modify the codebase and tailor dashboards to your exact requirements. The platform supports custom visualization plugins and lets you control every aspect of dashboard design and data connection. For teams that need flexibility and ownership over their analytics stack, Superset offers a level of customization that’s hard to match.
Apache Superset Key Features
Some other features in Apache Superset that are useful for analytics teams include:
- SQL Lab: Write, run, and save SQL queries directly within the platform.
- Role-Based Access Control: Manage user permissions and data access at a granular level.
- Extensive Chart Library: Choose from a wide range of built-in visualizations for your dashboards.
- Scheduled Reports: Automate the delivery of dashboard snapshots and reports to stakeholders.
Apache Superset Integrations
Native integrations are not currently listed.
Pros and Cons
Pros:
- Active community provides frequent feature updates
- No vendor lock-in for data storage
- SQL Lab enables direct query editing
Cons:
- Mobile dashboard experience is limited
- No official customer support channel
Altre alternative a Looker
Ecco alcune altre alternative a Looker che non sono entrate nella mia shortlist, ma che meritano comunque una considerazione:
- GoodData
For scalable multi-tenant analytics
- Zoho Analytics
For unified data blending across sources


Criteri di selezione delle alternative a Looker
Nella selezione delle migliori alternative a Looker da includere in questo elenco, ho considerato le esigenze più comuni degli acquirenti e i punti dolenti relativi ai prodotti di business intelligence e piattaforme di analisi dati, come la possibilità per utenti non tecnici di analizzare i dati e il supporto all'esplorazione dei dati in tempo reale. Ho anche utilizzato il seguente schema per mantenere la mia valutazione strutturata ed equa:
Funzionalità di base (25% del punteggio totale)
Per essere inclusa in questa lista, ogni soluzione doveva soddisfare questi casi d'uso comuni:
- Creare dashboard e report interattivi
- Collegarsi a più fonti dati
- Visualizzare i dati con grafici e tabelle
- Pianificare e automatizzare la consegna dei report
- Condividere insight con i membri del team
Funzionalità aggiuntive distintive (25% del punteggio totale)
Per restringere ulteriormente la concorrenza, ho considerato anche funzionalità uniche, come:
- Capacità di query in linguaggio naturale
- Analisi incorporata per applicazioni esterne
- Controlli avanzati di governance dei dati
- Collaborazione in tempo reale sui report
- Analisi dei dati supportate da intelligenza artificiale
Usabilità (10% del punteggio totale)
Per valutare l'usabilità di ciascun sistema, ho considerato i seguenti aspetti:
- Navigazione intuitiva e struttura del menu
- Interfaccia dal design pulito e moderno
- Numero minimo di clic per completare le attività comuni
- Layout della dashboard personalizzabili
- Prestazioni reattive con grandi quantità di dati
Onboarding (10% del punteggio totale)
Per valutare l'esperienza di onboarding di ciascuna piattaforma, ho considerato i seguenti aspetti:
- Disponibilità di tour guidati passo dopo passo
- Accesso a video formativi e documentazione
- Template predefiniti per dashboard e report
- Chatbot integrati per il supporto all'onboarding
- Webinar di onboarding, dal vivo o registrati
Assistenza clienti (10% del punteggio totale)
Per valutare i servizi di assistenza clienti di ogni fornitore di software, ho considerato i seguenti aspetti:
- Disponibilità di diversi canali di supporto
- Tempi di risposta rapidi alle richieste
- Accesso a una knowledge base ricercabile
- Disponibilità di customer success manager dedicati
- Forum della community per il supporto tra pari
Rapporto qualità/prezzo (10% del punteggio totale)
Per valutare il rapporto qualità/prezzo di ogni piattaforma, ho preso in considerazione i seguenti criteri:
- Piani tariffari trasparenti e flessibili
- Funzionalità incluse in ogni fascia di prezzo
- Disponibilità di prova gratuita o demo
- Nessuna tariffa nascosta o addebiti imprevisti
- Sconti per impegni annuali o per volumi
Recensioni dei clienti (10% del punteggio totale)
Per farmi un'idea della soddisfazione complessiva dei clienti, ho considerato i seguenti elementi nella lettura delle recensioni degli utenti:
- Feedback positivi sulla facilità d'uso
- Segnalazioni di affidabilità delle prestazioni
- Soddisfazione per il supporto clienti
- Valore offerto in rapporto al prezzo pagato
- Frequenza degli aggiornamenti e dei miglioramenti delle funzionalità
Perché cercare un'alternativa a Looker?
Sebbene Looker sia una buona scelta come piattaforma di Business Intelligence e Analisi dei Dati, ci sono diversi motivi per cui alcuni utenti cercano soluzioni alternative. Potresti voler trovare un'alternativa a Looker perché…
- Vuoi uno strumento che non richieda conoscenze di SQL
- Hai bisogno di prezzi più flessibili o trasparenti
- Preferisci un'interfaccia di analisi in stile foglio di calcolo
- Necessiti di controlli di governance dei dati più avanzati
- Desideri una configurazione e un onboarding più veloci per i nuovi utenti
- Vuoi integrazioni native con specifici data warehouse cloud
Se ti riconosci in uno di questi punti, sei nel posto giusto. Il mio elenco contiene diverse soluzioni di Business Intelligence e di Analisi dei Dati meglio adatte a team che affrontano queste sfide con Looker e sono alla ricerca di soluzioni alternative.
Funzionalità principali di Looker
Ecco alcune delle principali funzionalità di Looker, per aiutarti a confrontare ciò che le soluzioni alternative possono offrire:
- Modelizzazione dei dati con il linguaggio LookML
- Dashboard e visualizzazioni personalizzabili
- Analisi incorporata per applicazioni esterne
- Distribuzione programmata e automatizzata dei report
- Integrazione con i principali data warehouse cloud
- Controlli di accesso basati su ruoli e permessi
- Esplorazione e interrogazione dei dati in tempo reale
- Accesso alle API per integrazioni personalizzate
- Controllo delle versioni per i contenuti analitici
- Strumenti di collaborazione per la condivisione delle informazioni