10 Best Business Intelligence Platforms In 2026

10 Best Business Intelligence Platforms Shortlist


With so many different business intelligence platforms available, figuring out which is right for you is tough. You know you want to leverage your data assets for strategic advantages, operational improvements, and overall business growth but need to figure out which tool is best. I've got you! In this post I'll help make your choice easy, sharing my personal experiences using dozens of different business intelligence tools with various teams and data sets, with my picks of the best business intelligence platforms.
Why Trust Our Business Intelligence Platforms Reviews?
We’ve been testing and reviewing business intelligence platform since 2022. As revenue operation leaders ourselves, we know how critical and difficult it is to make the right decision when selecting software.
We invest in deep research to help our audience make better software purchasing decisions. We’ve tested more than 2,000 tools for different RevOps use cases and written over 1,000 comprehensive software reviews. Learn how we stay transparent & our business intelligence platform review methodology.
Table of Contents
- Best Software Shortlist
- Why Trust Us?
- Compare Specs
- Reviews
- Other Business Intelligence Platforms
- Related Business Intelligence Platform Reviews
- Selection Criteria
- How To Choose
- Trends In Business Intelligence Platforms
- What Are Business Intelligence Platforms?
- Features
- Benefits
- Costs and Pricing
- FAQs
| Tool | Best For | Trial Info | Price | ||
|---|---|---|---|---|---|
| 1 | Best for live BI reporting in spreadsheets | Free plan available | From $49/month (billed annually) | Website | |
| 2 | Best for extensive data integration | 15-day free trial + free plan + free demo available | From $24/month (billed annually) | Website | |
| 3 | Best for automated reporting without an analyst | Free plan available | From $29/month | Website | |
| 4 | Best for accelerating decision-making with the help of AI | Free trial + free plan available | From $15/user/month (billed annually) | Website | |
| 5 | Best for automated data transformation | Free demo available | Pricing upon request | Website | |
| 6 | Best for using automated SQL generation | 14-day free trial + free demo available | From $13/user/month | Website | |
| 7 | Best for business analysts and data scientists | 30-day free trial | From $125/user/month (billed annually) | Website | |
| 8 | Best for web-based data modeling solutions | 30-day free trial available | From $11.25/user/month | Website | |
| 9 | Best for end-to-end enterprise performance management | 30-day free trial + free demo available | Pricing upon request | Website | |
| 10 | Best for enterprise-grade self service to increase user autonomy | Free demo available | Pricing upon request | Website |
-

Prisync
Visit WebsiteThis is an aggregated rating for this tool including ratings from Crozdesk users and ratings from other sites.4.7 -
Expedite Commerce
Visit Website -
QuickBooks Online
Visit WebsiteThis is an aggregated rating for this tool including ratings from Crozdesk users and ratings from other sites.4


Best Business Intelligence Platform Reviews
Are you ready to start exploring the top business intelligence tools on my list? Keep reading to discover platform summaries, standout features, pricing and free trial information, and a few pros and cons for each solution. I’ve also included some information on integrations to help you figure out whether a tool fits into your tech stack.
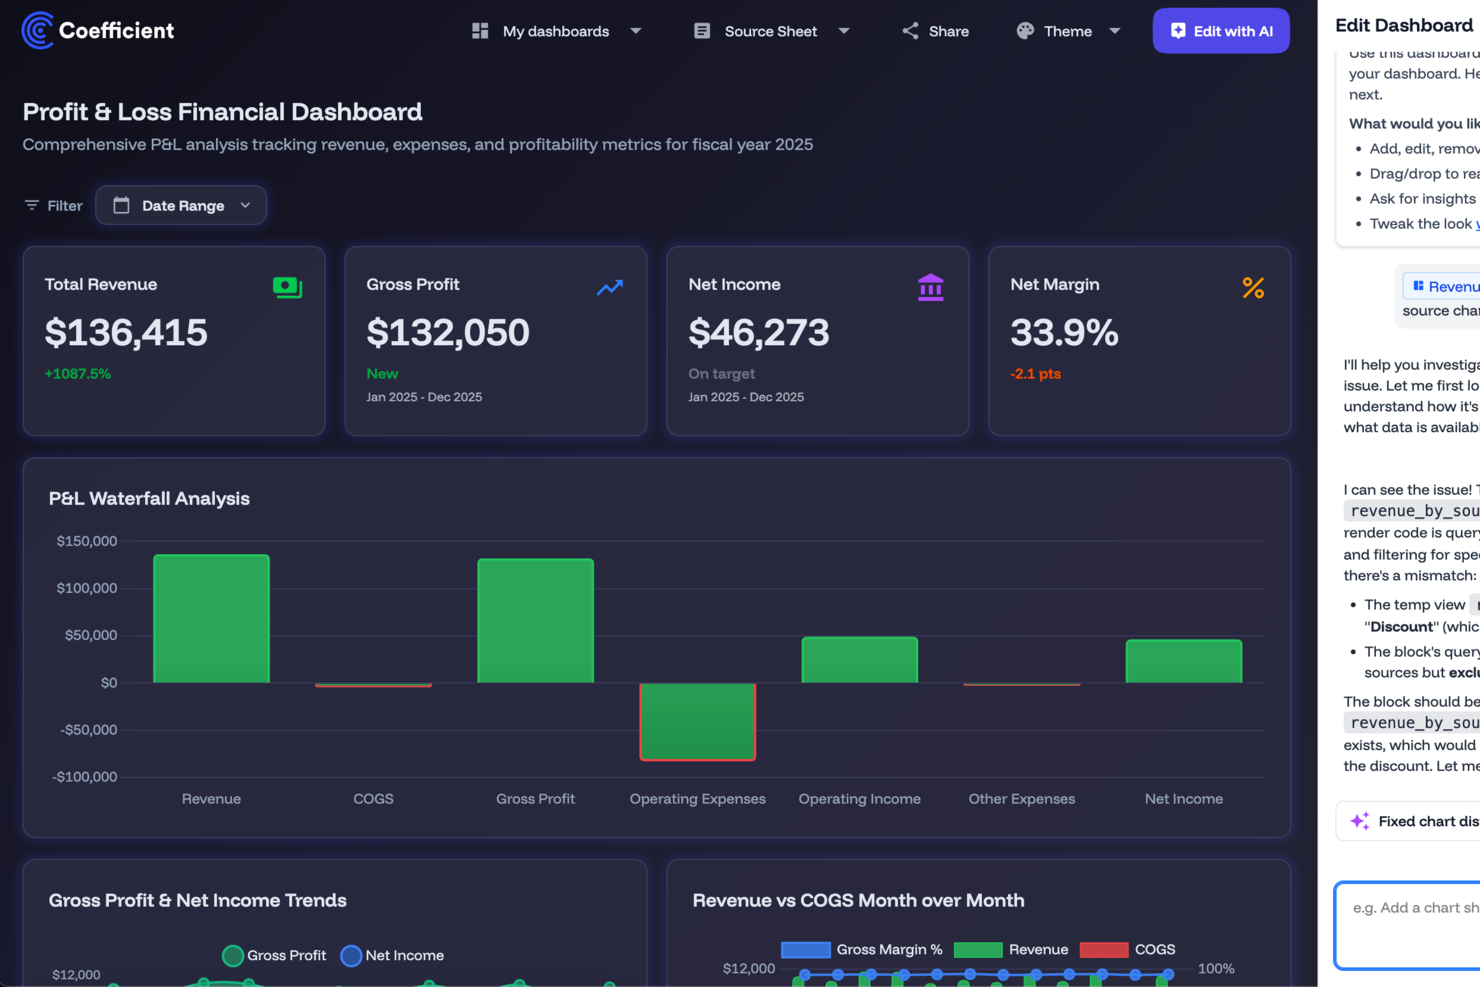
Coefficient is a spreadsheet-native BI tool that pulls live data from CRMs, databases, and data warehouses directly into Google Sheets and Excel for real-time reporting, dashboards, and analysis.
Who Is Coefficient Best For?
Coefficient is a good fit for RevOps and sales ops teams who already live in spreadsheets and need live CRM and pipeline data without rebuilding their reporting in a new tool.
Why I Picked Coefficient
I've included Coefficient in my top picks because it closes the gap between where data lives and where most BI work actually happens: spreadsheets. I like that live data from sources like Salesforce or Snowflake auto-refreshes on a schedule, so my reports reflect current pipeline or revenue numbers without manual exports. The AI-powered pivot and chart builder lets me go from raw CRM data to a formatted dashboard inside Google Sheets in minutes, which I've found genuinely useful when stakeholders want answers fast.
Coefficient Key Features
- Data snapshots: Capture point-in-time records of live data to track changes and trends over time directly in your spreadsheet.
- Slack and email alerts: Set threshold-based alerts that notify your team when key metrics hit defined conditions.
- Two-way writeback: Push data edits made in Google Sheets or Excel back to the connected source system without leaving your spreadsheet.
- 150+ pre-built connectors: Link CRMs, data warehouses, databases, and marketing platforms without writing code.
Pros and Cons
Pros:
- Custom connectors allow integration with unique data sources
- Automated alerts via Slack or email keep teams informed
- User-friendly interface requires minimal training to operate
Cons:
- Hourly automated refreshes limited to higher-tier plans
- Fewer advanced BI features than enterprise competitors

Zoho Analytics is a self-service BI and analytics platform that covers the full data pipeline—from connecting 500+ data sources and preparing data to building interactive dashboards, running predictive analysis, and embedding analytics into your own apps.
Who Is Zoho Analytics Best For?
Zoho Analytics is a good fit for data and operations teams at mid-sized businesses that need to consolidate data from across a wide stack of tools into a single analytics layer.
Why I Picked Zoho Analytics
Zoho Analytics is one of my top picks because I love the sheer breadth of its data connectivity. You can pull live data from databases, cloud storage, files, and dozens of business apps spanning CRM, marketing, finance, HR, and ecommerce—all from one platform. The no-code custom connector builder lets you connect apps that aren't already covered by a native integration. Zoho Flow automates data imports from 1,000+ additional apps to keep reports current without manual refreshes.
Zoho Analytics Key Features
- Ask Zia: A conversational AI assistant that lets you query your data in plain language and returns charts, summaries, and insights without writing any SQL.
- AutoML model builder: A built-in tool for training, evaluating, and deploying custom machine learning models directly on your datasets using a no-code interface.
- What-if analysis: A scenario modeling tool that lets you adjust variables in your data to simulate different outcomes and visualize the impact on your metrics.
- Embedded analytics: A white-labeled analytics layer you can embed directly into your own product or internal apps with full dashboard and reporting functionality.
Pros and Cons
Pros:
- Can integrate with many data sources, including on-premise systems
- Excellent visual representation of data
- Live, customizable dashboards
Cons:
- Mobile app sometimes has delayed notifications
- Potential learning curve when customizing dashboards
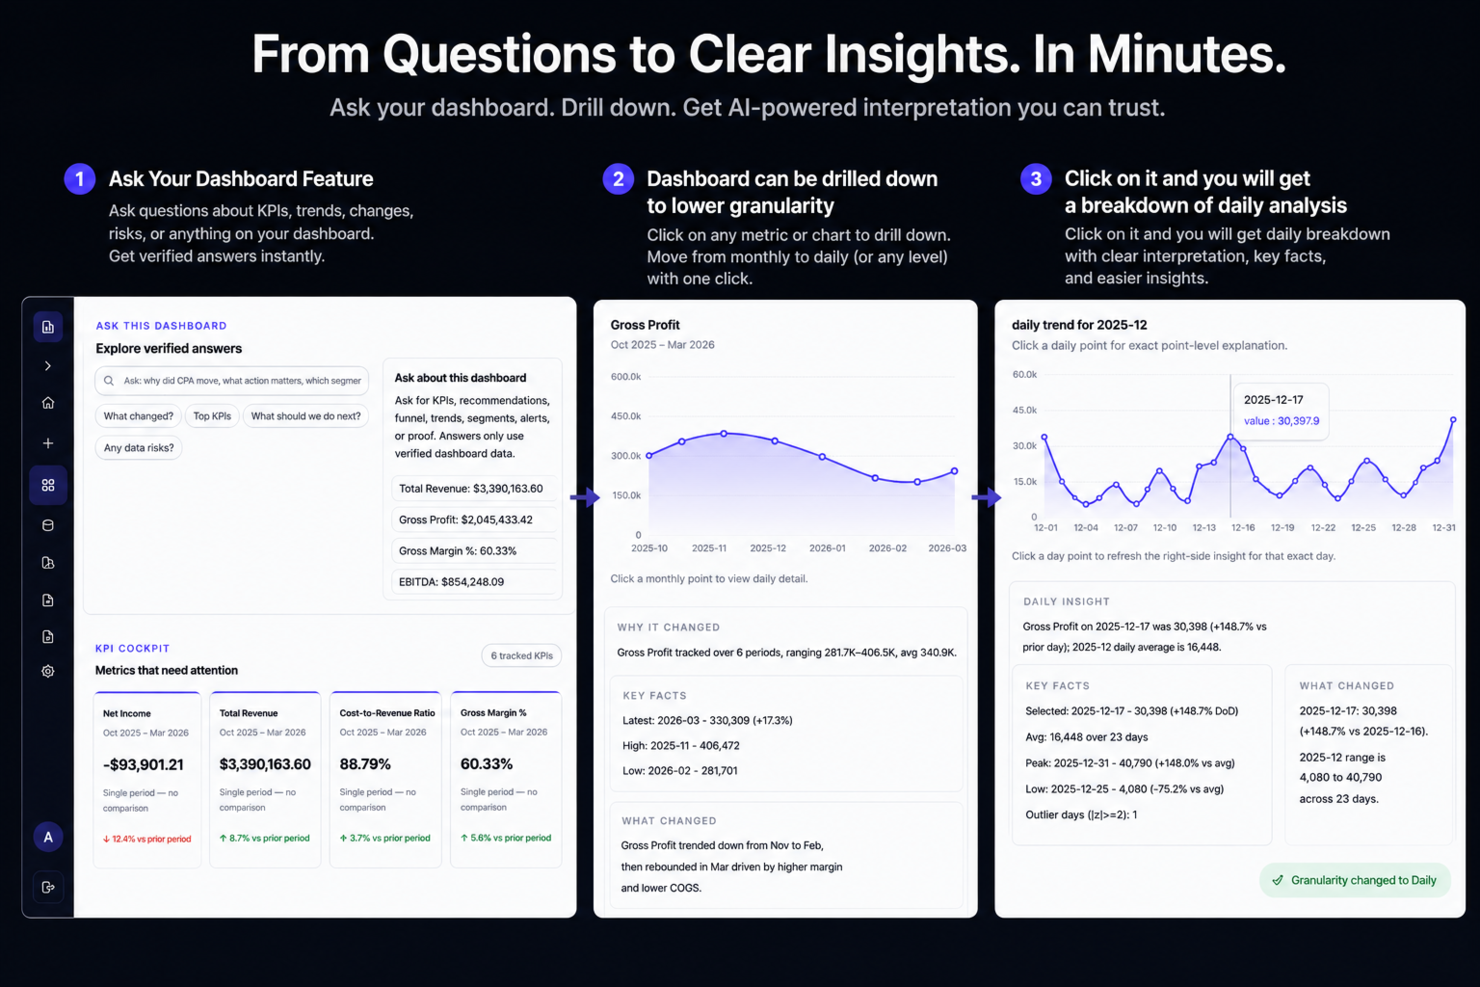
Signara is an agentic analytics platform for growing businesses. Plug in your data and Signara automatically generates dashboards, KPI narratives, and recommended next steps, no data analyst or engineer needed. The math is deterministic, so the numbers are ones you can trust. Connects to HubSpot, Snowflake, BigQuery, and more.
Who Is Signara Best For?
Signara is a good fit for marketing and revenue teams at small to mid-sized companies that need automated reporting without a dedicated data analyst on staff.
Why I Picked Signara
I've included Signara in my top picks because it pulls from both live operational data sources and file-based inputs in one place. I connect a live Snowflake or BigQuery warehouse alongside an Excel upload, and Signara's deterministic KPI engine runs consistent, auditable math across all of it. I especially like the driver analysis layer, which surfaces what moved across those blended sources and by how much, without me needing to manually reconcile anything.
Signara Key Features
- AI narrative generation: Automatically writes commentary on what changed across your KPIs, using consulting-grade frameworks tuned to marketing, FP&A, and revenue reporting.
- Full audit trail: Every figure in a generated narrative links back to its computed source, so you can trace any number to its origin in the raw data.
- PPTX and dashboard output: Generates both an interactive dashboard and a downloadable PowerPoint deck from the same analysis run.
- Decision framing: Surfaces prioritized next-step recommendations alongside each report, categorized by growth opportunities, watch items, and actions.
Signara Integrations
Signara offers native connectors to HubSpot, Snowflake, Databricks, BigQuery, MySQL, and Google Sheets, and also accepts file-based uploads from Excel and CSV sources.
Pros and Cons
Pros:
- Auto-generates board-ready PPTX decks
- Deterministic math prevents number inconsistencies
- AI generates narrative explanations automatically
Cons:
- No mobile app for on-the-go access
- Limited connector library for data sources

Tableau is a visual analytics and business intelligence platform that lets you connect to data sources, build interactive dashboards, apply AI-powered analysis, and share insights across your organization.
Who Is Tableau Best For?
Tableau is a strong fit for data analysts and BI teams at mid-size to enterprise organizations that need to explore and visualize large, complex datasets.
Why I Picked Tableau
I've included Tableau in my top picks because its AI capabilities are genuinely built into the analysis workflow, not bolted on. Tableau Pulse delivers personalized, AI-generated metric digests directly in Slack or Microsoft Teams, surfacing the "why" behind KPI changes without anyone pulling a report. I also like Tableau Agent, which lets you type a natural language prompt and get a calculated field, a pivot, or a finished visualization in seconds.
Tableau Key Features
- Drag-and-drop dashboard builder: Create interactive, multi-chart dashboards by dragging dimensions and measures onto a canvas without writing code.
- Tableau Prep Builder: Clean, reshape, and combine data from multiple sources using a visual, step-by-step flow before it hits your dashboards.
- Live and extract data connections: Query data live from your source or pull an extract for faster, offline analysis.
- Row-level security: Control which users see which rows of data directly within Tableau, without modifying the underlying database.
Pros and Cons
Pros:
- Can handle large data sets
- Allows for custom SQL
- Supports almost all connectors
Cons:
- Overall UI could be better
- The server can be a bit slow
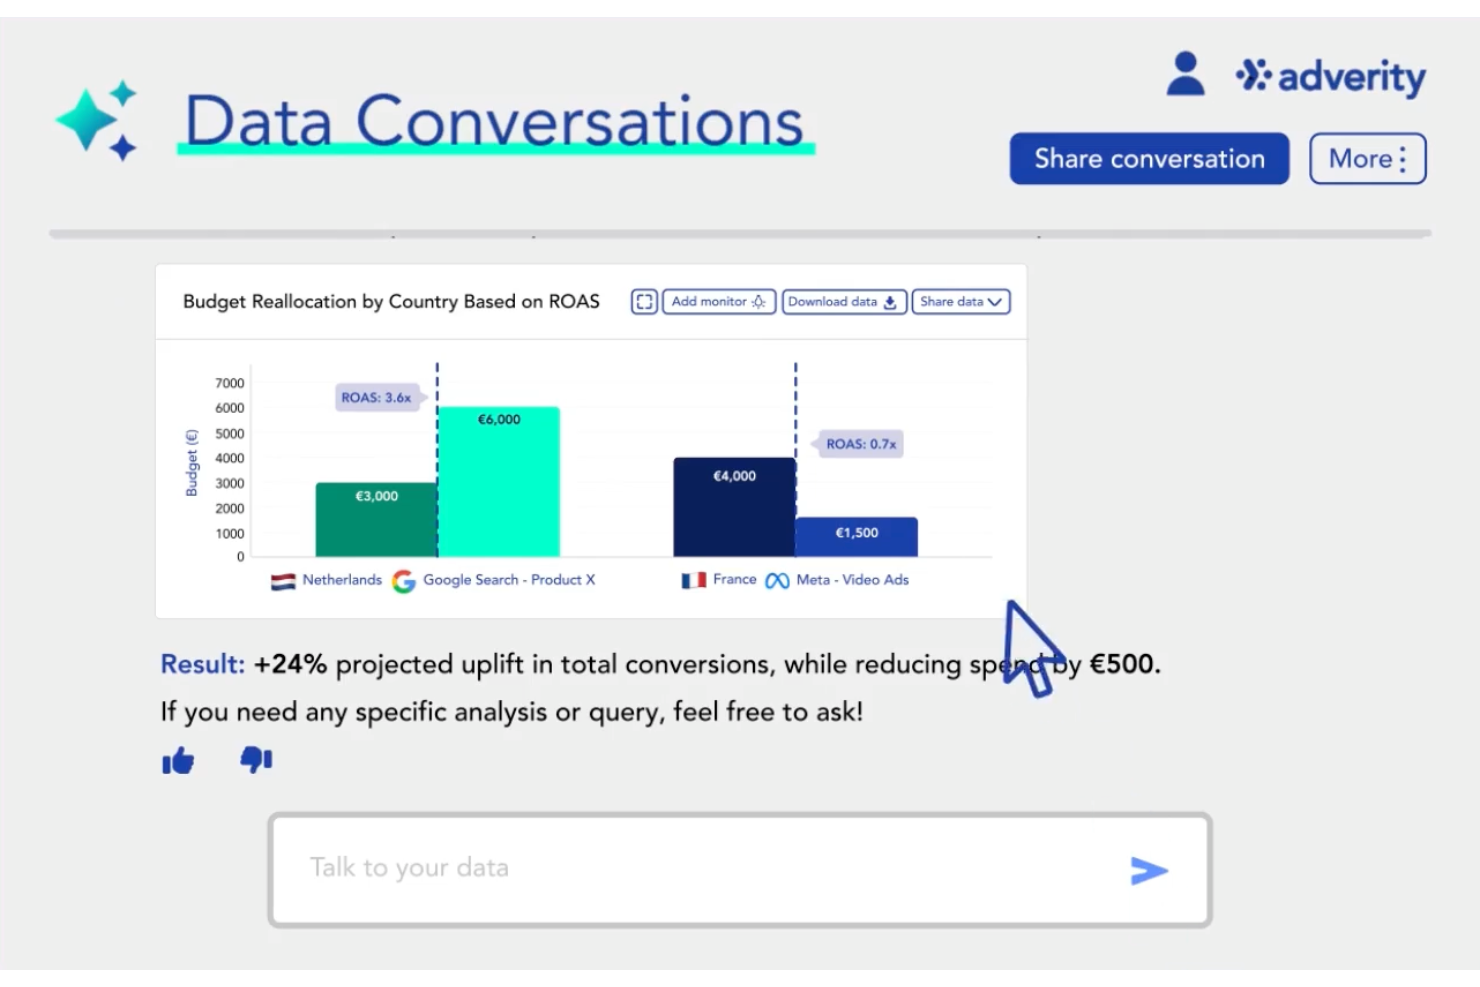
Adverity is a marketing data integration and analytics platform that combines data ingestion from 600+ sources with ETL/ELT transformation, data quality monitoring, and AI-powered querying to give revenue and analytics teams a unified, analysis-ready data layer.
Who Is Adverity Best For?
Adverity is a strong fit for mid-to-enterprise marketing and data teams managing high volumes of fragmented data across paid media, CRM, and e-commerce platforms.
Why I Picked Adverity
I included Adverity in my top picks because its AI-powered transformation copilot stands out. Instead of writing transformation logic manually, you describe what you need in plain language and Adverity builds it for you. I also like the Smart Data Dictionary, which automatically maps metrics and dimensions across all your sources and maintains full data lineage. The real-time transformation preview lets you test changes live on your dataset before committing, reducing debugging later.
Adverity Key Features
- Data quality suite: Get a single dashboard view of quality metrics across your warehouse, with automated monitors for duplication, volume, validity, and consistency issues.
- Smarter scheduling: Adverity automatically adjusts data fetch times based on real-time API conditions and historical trends, so your data refreshes without manual intervention.
- dbt integration: Schedule and monitor dbt model executions directly within Adverity, with job status notifications for tracking and troubleshooting.
- Multi-destination data push: Send data to multiple destinations simultaneously, keeping everything in sync across your entire tech stack.
Pros and Cons
Pros:
- Reliable cross-platform data transfers for large marketing and advertising datasets
- Responsive support team helps resolve integration and pipeline configuration issues
- Pre-built connectors simplify integrating marketing and analytics data sources
Cons:
- Managing large-scale pipelines can become time-consuming during setup
- Complex onboarding process for configuring connectors and data pipelines
New Product Updates from Adverity
Adverity Enhances Connectors and Adds TikTok GMV Max
Adverity updates connectors for Amazon Ads, SmartNews Ads, Indeed, and monday.com, and introduces the TikTok GMV Max connector. These updates improve data accuracy, control, and performance across integrations. For more information, visit Adverity’s official site.
 .
.
Strategy (formerly MicroStrategy) is an enterprise BI and analytics platform built around a universal semantic layer that unifies data across cloud, on-prem, and hybrid environments, with capabilities spanning governed dashboards, AI-powered analytics, embedded intelligence, and automated SQL generation.
Who Is MicroStrategy Best For?
Strategy is a strong fit for large enterprises and data-heavy organizations that need governed, scalable analytics across complex, multi-source data environments.
Why I Picked MicroStrategy
Strategy (formerly MicroStrategy) is on my shortlist because Auto SQL is an AI-integrated tool within the schema editor built specifically for SQL generation and editing. My team can describe a data need in plain language and Auto SQL produces the Freeform SQL table definition, removing a bottleneck when working with complex, multi-table schemas. It also provides optimization recommendations for specific databases like Snowflake, helping match SQL conventions to the target platform. Context-aware generation inside the schema editor, rather than in a separate tool, makes it useful for enterprise BI workflows.
MicroStrategy Key Features
- Universal semantic layer: Mosaic connects to 200+ data sources across cloud, on-prem, and hybrid environments without moving data, applying consistent metric definitions across every report.
- Auto Answers: A natural language Q&A feature that lets users ask data questions in plain text and receive instant, governed answers directly within dashboards.
- HyperIntelligence: Injects contextual, card-based analytics into web apps and SaaS tools users already work in, without requiring them to leave those tools.
- Embedded analytics: Lets you embed governed dashboards and reports into external products, portals, or internal apps while enforcing existing security rules.
Pros and Cons
Pros:
- Quick implementation and installation
- Intuitive user navigation
- Easy to learn the tools
Cons:
- Platform isn’t as responsive on smaller screens
- Cost is higher than other tools

TIBCO Spotfire is an industrial analytics and business intelligence platform that combines visual data exploration, predictive analytics, machine learning, and explainable AI to support expert-driven decision-making across complex, data-intensive environments.
Who Is TIBCO Spotfire Best For?
TIBCO Spotfire is well-suited for enterprise teams in data-heavy industries like manufacturing, energy, life sciences, and financial services.
Why I Picked TIBCO Spotfire
I've included TIBCO Spotfire in my top picks because it provides business analysts and data scientists a single environment where visual exploration, machine learning, and explainable AI work side by side. I particularly like how it handles fragmented industrial data—connecting time-series signals, spatial context, and historical events into a shared analytical view without requiring analysts to stitch together separate tools. The AI-assisted analysis features surface patterns and evaluate potential outcomes while keeping domain expertise in the loop, which is important for high-stakes process and production data.
TIBCO Spotfire Key Features
- Geospatial analytics: Build multi-level, map-based visualizations that layer location data alongside process, production, or operational data for geographic pattern analysis.
- Natural language query: Search your data using plain-language queries to find data sources and surface insights without writing code or building queries manually.
- Automation services: Schedule report delivery, trigger snapshot captures on defined events, and set condition-based actions to keep teams updated without manual intervention.
- Data wrangling and transformation: Clean, prepare, and transform data from structured and unstructured sources directly within the platform before analysis.
Pros and Cons
Pros:
- Truly beautiful data visualizations
- Cloud and web deployment
- Easy to use and learn
Cons:
- No universal pricing model
- No version for Mac OS

IBM Cognos Analytics is an enterprise BI platform that combines self-service data modeling, AI-assisted reporting, interactive dashboards, and data visualization tools within a centralized, governed analytics environment.
Who Is IBM Cognos Analytics Best For?
IBM Cognos Analytics is a strong fit for enterprise data and analytics teams that need centralized governance alongside self-service reporting across large, complex data environments.
Why I Picked IBM Cognos Analytics
IBM Cognos Analytics earns its spot on my shortlist because of how well its web-based data modeling capabilities hold up in real enterprise environments. I particularly like the self-service modeling interface, where analysts can build and certify data models directly in the browser without handing work off to IT. Pair that with the AI Assistant, which lets you query those models in natural language and instantly generate dashboards, and your team can go from raw data to a shareable visualization in one session.
IBM Cognos Analytics Key Features
- Pixel-perfect report authoring: Build formatted, print-ready reports with drag-and-drop layout tools designed for precise data presentation.
- Predictive forecasting: Use built-in statistical models to generate time-series forecasts and trend analyses directly within your dashboards.
- Role-based access control: Assign data access permissions at the folder, report, or data source level to enforce governance across teams.
- Scheduled report delivery: Automate report distribution by scheduling exports to email, file systems, or shared locations on a recurring basis.
Pros and Cons
Pros:
- No need to understand SQL
- AI-generated visualization
- Mobile accessibility with web-based logins
Cons:
- Lag time when processing big data sets
- Integrating data sources is a little clunky

Oracle Business Intelligence is an enterprise BI suite that combines query, reporting, ad hoc analysis, dashboards, mobile analytics, OLAP, data mining, and financial performance management applications within a single, unified architecture.
Who Is Oracle Business Intelligence Best For?
Oracle Business Intelligence is a strong fit for large enterprises running Oracle infrastructure who need a unified platform for reporting, analytics, and financial planning.
Why I Picked Oracle Business Intelligence
Oracle Business Intelligence earns its spot as one of the best on my shortlist because it's one of the few platforms that genuinely covers the full performance management lifecycle in a single architecture. I particularly like Oracle BI Delivers, which monitors business activity in real time and triggers multi-step analytical workflows across users and applications. Combined with Oracle Real-Time Decisions, which blends rules-based logic with predictive analytics to surface recommendations inside live business processes, the platform goes well beyond standard reporting.
Oracle Business Intelligence Key Features
- Oracle BI Answers: A self-service ad hoc query tool that lets users build and run their own analyses against a shared semantic layer without writing SQL.
- Oracle BI Publisher: A formatted enterprise reporting tool for generating high-volume, pixel-perfect documents like invoices, regulatory filings, and operational reports.
- Interactive dashboards: Role-based dashboards that surface relevant KPIs, charts, and reports tailored to each user's function or access level.
- Oracle BI Server semantic layer: A centralized metadata repository that maps complex data sources into business-friendly terms, keeping metrics consistent across all reports.
Pros and Cons
Pros:
- Minimal training needed to get started
- User friendly interface and navigation
- Provides tutorials to guide you through the tools
Cons:
- Limited mobile capabilities
- Limited customization in reporting
Best for enterprise-grade self service to increase user autonomy

SAP BusinessObjects is an on-premises business intelligence suite that covers data reporting, visualization, ad hoc analytics, and enterprise-wide sharing of insights on a single, scalable platform.
Who Is SAP BusinessObjects Best For?
SAP BusinessObjects is a strong fit for large enterprises that need to scale BI access across thousands of users without sacrificing governance or data consistency.
Why SAP BusinessObjects Stands Out
SAP BusinessObjects stands out for how deeply it's built around enterprise-grade self-service. Web Intelligence lets business users build, modify, and share their own reports without routing every request through IT, which in large organizations changes how fast teams can act on data. I also like SAP Lumira for self-service data visualization, since it lets analysts explore data and build dashboards on their own terms. Together, these tools give non-technical users real autonomy without removing governance controls from the people who need them.
SAP BusinessObjects Key Features
- Crystal Reports: Build pixel-perfect, formatted operational and transactional reports designed for precise print and PDF output.
- Universe semantic layer: Map complex database structures to plain business terminology so analysts query data without needing SQL knowledge.
- Scheduling and publication: Automate report delivery to individuals or groups on a set schedule across multiple output formats.
- Mobile BI access: View dashboards and reports on mobile devices with an interface optimized for smaller screens.
Pros and Cons
Pros:
- Excel-based functionality is easy to use
- Robust training and online courses
- No need for technical data analysts
Cons:
- User interface is a little cumbersome
- Limited data transformation capabilities
Other Business Intelligence Platforms
I couldn’t complete this list of analytics platforms without mentioning a few more options. Check out these additional solutions to see if one of them fits your needs better than those on the main list.
- QlikView
For accessing Qlik Sense to leverage AI data exploration
- SAS Business Intelligence
For automated insights that prioritize context
- Microsoft Power BI
For creating rich data visualizations
- Pentaho
For scaling to enterprise-grade data management
- Yellowfin BI
For automated analysis and storytelling
- Compass
For ensuring a better developer experience
- Sisense
For using analytics tools to enhance your final product without any coding
- Klipfolio
Business intelligence tool for self-service analytics and reporting
- Domo
For intuitive dashboards and reporting tools that democratize your data
- Mopinion
All-in-one business intelligence software for digital channels


Related Business Intelligence Platform Reviews
If you still haven't found what you're looking for here, check out these tools closely related to business intelligence platforms that we've tested and evaluated.
- Sales Software
- Lead Management Software
- Business Intelligence Software
- Contract Management Software
- Revenue Management System
- CPQ Software
Selection Criteria For Business Intelligence Platform
Selecting the ideal business intelligence platform involves a thorough assessment of its features, ensuring they align perfectly with specific business needs and revenue operations management. Drawing from my personal experiences and extensive research, I've developed a set of criteria to evaluate these platforms comprehensively.
Core Business Intelligence Platform Functionality: 25% of total weighting score
To be considered for inclusion on my list of the best business intelligence platform, the solution had to support the ability to fulfill common use cases:
- Streamlining data processing and integration
- Enhancing data visualization and reporting
- Providing scalable and secure data storage solutions
- Facilitating predictive and prescriptive analytics
- Supporting decision-making with real-time data access
Additional Standout Features: 25% of total weighting score
- Incorporation of AI and machine learning for advanced data analysis
- Exceptional customization options for dashboards and reports
- Superior integration capabilities with new market tools and platforms
- Cutting-edge security features ensuring data integrity
- Innovative collaboration features for team-based analytics
Usability: 10% of total weighting score
- Balance between advanced functionality and user-friendly interface
- Streamlined navigation and intuitive layout
- Accessibility across devices and platforms
Onboarding: 10% of total weighting score
- Comprehensive training materials like video tutorials and user guides
- Quick setup and deployment processes
- Interactive assistance such as chatbots and live support
Customer Support: 10% of total weighting score
- Availability of multiple support channels
- Responsiveness and effectiveness of the support team
- Proactive customer service and support
Value For Money: 10% of total weighting score
- Competitive pricing with clear delineation of feature tiers
- Flexibility in pricing plans to suit various business sizes
- Transparent cost-benefit analysis
Customer Reviews: 10% of total weighting score
- Positive feedback on functionality and ease of use
- Critiques on areas of improvement and how they are addressed
- Customer testimonials highlighting specific benefits
These criteria ensure that the selected business intelligence platform not only meets the fundamental requirements but also offers unique features that provide significant value to businesses, enhancing their ability to effectively manage and optimize revenue operations.
How To Choose Business Intelligence Platforms
With so many different business intelligence platforms available, it can be challenging to make decisions on what tool is going to be the best fit for your needs.
As you're shortlisting, trialing, and selecting business intelligence platform, consider the following:
- What problem are you trying to solve - Start by identifying the business intelligence platform feature gap you're trying to fill to clarify the features and functionality the tool needs to provide.
- Who will need to use it - To evaluate cost and requirements, consider who'll be using the software and how many licenses you'll need. You'll need to evaluate if it'll just be the revenue operation leaders or the whole organization that will require access. When that's clear, it's worth considering if you're prioritizing ease of use for all or speed for your business intelligence platform power users.
- What other tools it needs to work with - Clarify what tools you're replacing, what tools are staying, and the tools you'll need to integrate with, such as accounting, CRM, or HR software. You'll need to decide if the tools will need to integrate together or if you can replace multiple tools with one consolidated business intelligence platform.
- What outcomes are important - Consider the result that the software needs to deliver to be considered a success. Consider what capability you want to gain or what you want to improve, and how you will be measuring success. For example, an outcome could be the ability to get greater visibility into performance. You could compare business intelligence platform features until you’re blue in the face but if you aren’t thinking about the outcomes you want to drive, you could be wasting a lot of valuable time.
- How it would work within your organization - Consider the software selection alongside your workflows and delivery methodology. Evaluate what's working well and the areas that are causing issues that need to be addressed. Remember every business is different — don’t assume that because a tool is popular that it'll work in your organization.
Trends In Business Intelligence Platforms For 2026
The rapid evolution of business intelligence platforms reflects a broader trend towards enhancing analytical capabilities and streamlining revenue operations in businesses of all sizes. Let's explore the most significant developments:
Core Trends and Evolutions
- Integration with Emerging Technologies: Platforms are increasingly integrating AI and machine learning to automate data analysis and provide deeper insights.
- Real-time Data Processing: There's a shift towards supporting real-time analytics to help businesses react more quickly to market changes.
Novel and Unusual Functionalities
- Predictive Analytics: The use of advanced predictive models to forecast trends and behaviors is becoming more common, providing businesses with a proactive tool to anticipate future challenges.
- Augmented Analytics: Tools are incorporating augmented reality to visualize data in new ways, making complex information more accessible and understandable.
Most Important and In-Demand Features
- Data Visualization Tools: These remain critically important, with enhancements that allow for more customizable and interactive dashboards.
- Collaborative Features: As remote work continues to dominate, BI platforms are enhancing features that support collaboration across teams and geographies.
Declining Features
- Static Reporting: The demand for static, traditional reports is diminishing in favor of dynamic, interactive reporting systems that offer users deeper insights.
These trends demonstrate a significant transformation in the business intelligence sector, driven by the need to adapt to a fast-paced, data-driven business environment. For revenue operation leaders, selecting a BI platform that aligns with these trends is crucial to maintaining competitive advantage.
What Are Business Intelligence Platforms?
Business intelligence platforms are technological solutions that facilitate comprehensive data analysis for businesses. These platforms integrate, process, and analyze data from various sources, presenting it in an accessible and actionable format through reports, dashboards, and visualizations. They serve as centralized systems for data-driven insights, catering to the diverse information needs within an organization, from operational metrics to strategic decision-making.
The benefits of business intelligence platforms include enabling informed decision-making through data-driven insights. They help in understanding market trends, customer behavior, and internal business processes, leading to improved strategic planning and operational efficiency. These platforms provide a competitive edge by offering a deeper analysis of business performance and market dynamics. Additionally, they support scalability, adapting to the growing and evolving data needs of a business, and facilitate risk management by identifying potential issues and opportunities.
Features Of Business Intelligence Platforms
Selecting a business intelligence platform to manage revenue operations requires understanding the key features that drive efficiency and insight. Here are the most critical features to look for:
- Real-Time Analytics: Provides immediate insights into business performance.
- Essential for making timely decisions that can significantly impact revenue growth.
- Data Visualization: Transforms complex data sets into understandable graphics.
- Crucial for communicating insights across the organization quickly and effectively.
- Predictive Analytics: Uses historical data to forecast future trends.
- Helps anticipate market changes and adjust strategies accordingly.
- Data Integration: Combines data from various sources into a cohesive platform.
- Vital for a holistic view of the business operations and customer interactions.
- Customizable Dashboards: Allows users to tailor interfaces to their specific needs.
- Enhances user engagement and productivity by focusing on key metrics.
- Collaboration Tools: Facilitates sharing insights and reports across teams.
- Supports a cohesive strategy and alignment across different departments.
- Scalability: Adapts to the growing amount of data and evolving business needs.
- Ensures the platform will continue to be useful as the business expands.
- User Access Management: Controls who can see and manipulate data.
- Important for maintaining data security and integrity.
- Mobile Accessibility: Provides access to data and insights on the go.
- Increases the flexibility and responsiveness of teams.
These features collectively ensure that a business intelligence platform can effectively support and enhance revenue operations by providing deep insights, fostering communication, and ensuring data-driven decision-making processes.
Benefits Of Business Intelligence Platforms
Business intelligence platforms provide essential tools for organizations looking to enhance their revenue operations management. Here are five key benefits:
- Enhanced Decision Making: Delivers actionable insights for informed decision-making.
- Facilitates strategic planning by providing accurate and up-to-date information.
- Increased Operational Efficiency: Automates data analysis processes.
- Reduces manual work and allows teams to focus on strategic tasks.
- Improved Data Quality and Accuracy: Centralizes data management.
- Helps maintain consistent and error-free data across the organization.
- Customizable Reporting: Offers tailored reports to meet specific business needs.
- Enables users to view data in formats that best suit their operational goals.
- Scalability: Adapts to growing data needs and business expansion.
- Supports business growth without the need for frequent software changes.
Costs & Pricing For Business Intelligence Platforms
Selecting the right business intelligence platform involves understanding different pricing plans tailored to meet various organizational needs and budgets. Here’s a breakdown of typical plan options available:
| Plan Type | Average Price | Common Features |
|---|---|---|
| Basic | $10 - $30 per user/month | Basic analytics, data visualization, limited dashboards |
| Professional | $50 - $100 per user/month | Advanced analytics, more integrations, custom reports |
| Enterprise | Custom pricing | Full feature access, advanced security, dedicated support |
| Free | $0 | Access to basic features, limited data capacity |
When choosing a plan, consider not just the cost but how the features align with your business size and needs. A plan that scales appropriately with your growth and provides essential analytical capabilities without overstretching your budget is ideal.
Business Intelligence Platform Frequently Asked Questions
There is plenty more to learn about business intelligence tools, so what other questions do you have? Here are some answers to the most common concerns to get you started.
Who uses business intelligence platforms?
Business intelligence tools are useful for nearly every industry, but adoption is quicker among some verticals, including healthcare, finance, and entertainment. Some departments in your organization which may benefit most from these platforms include:
- Sales: This team can gain new insights into market trends that ensure better sales strategies.
- Analysts: They can use this tool to better understand market trends and customer behavior.
- Marketing: They can use BI to analyze the effectiveness of campaigns for better optimization.
- IT Teams: Your technical teams can leverage BI to process large data sets and generate reports.
What are 5 systems for business intelligence?
There are many types of business intelligence, and BI software typically combines some or all of them into a single platform. Some of the most common tools you’ll see include:
- Spreadsheets: Widely used among those who prefer manual analytics, these include Google Sheets and Microsoft Excel.
- Data visualizations: From charts to graphs, visualizations are BI systems that make your data easier to read.
- Data mining tools: Finding and organizing large amounts of data isn’t simple, so these platforms leverage machine learning and artificial intelligence to make it work.
- Reporting software: This system reports, filters, organizes, and displays data in a way that allows you to surface insights faster.
- Online analytical processing: Also known as OLAP, you can use these tools to analyze datasets from various angles based on unique business perspectives.
Can business intelligence platforms predict market trends?
Yes, many business intelligence platforms are equipped with predictive analytics capabilities that analyze historical data and current market conditions to forecast future trends. These tools utilize algorithms and machine learning to provide insights that can help companies anticipate market movements and adjust their strategies accordingly.
What customer support options are offered in business intelligence platforms?
Business intelligence platforms typically offer a range of customer support options including online support portals, live chat, email, and phone support. Some vendors also provide dedicated account managers and 24/7 support for critical issues, ensuring that businesses can get help whenever needed.
How do business intelligence platforms manage large data sets?
Business intelligence platforms are designed to handle large data sets efficiently. They use technologies such as data warehousing, in-memory processing, and data compression to improve data retrieval and performance. Advanced platforms also offer data governance tools to help ensure data quality and consistency across large datasets.
Additional RevOps Software
There are tons of other tools you may need to round out your tech stack. Check out my overviews of all these other solutions to find the right blend for your business needs:
- Cloud BI Tools
- Sales Analytics Software
- Revenue Intelligence Platforms
- Sales Intelligence Software
- Predictive Analytics Software
- Business Development Software
- Sales Forecasting Software
Conclusion
You may feel overwhelmed with all the information I just dropped on you, but it should be simple to narrow down your top few preferences from my list. Sign up for the free trials and demos to see how these tools actually perform and narrow your choices down even further. I’m confident you’ll be able to find the right tool for your needs.
And if you want to stay updated on the newest trends in the revops world, sign up for the newsletter to get weekly insights from the experts!