25 Best OLAP Tools Reviewed For 2026

10 Best OLAP Tools Shortlist


OLAP tools let you quickly analyze and query huge amounts of data, so you can make smarter business decisions with less hassle. Choosing the right OLAP tool saves you time and makes it simple to dig into your data exactly how you need.
Based on my hands-on experience testing dozens of OLAP tools across teams and tech stacks, I’ll walk you through the best options so you can find the one that truly fits your needs.
Why Trust Our Software Reviews
We’ve been testing and reviewing RevOps software since 2022. As RevOps leaders ourselves, we know how critical and difficult it is to make the right decision when selecting software.
We invest in deep research to help our audience make better software purchasing decisions. We’ve tested more than 2,000 tools for different RevOps use cases and written over 1,000 comprehensive software reviews. Learn how we stay transparent & our software review methodology.
Best OLAP Tools Summary
This comparison chart summarizes pricing details for my top OLAP tools selections to help you find the best one for your budget and business needs.
| Tool | Best For | Trial Info | Price | ||
|---|---|---|---|---|---|
| 1 | Best for data storytelling for your customers | Free demo available | Pricing upon request | Website | |
| 2 | Best for advanced management in mission-critical use cases | Free trial available | From $15/user/month (billed annually) | Website | |
| 3 | Best centralized data management for marketing teams | Free demo available | Pricing upon request | Website | |
| 4 | Best for predictive analytics using AI and machine learning | 30-day free trial + free demo available | Pricing upon request | Website | |
| 5 | Best for integrating with open-source languages, R, or Python | Free trial available | Pricing upon request | Website | |
| 6 | Best for building intelligent analytics into products | 7-day free trial available | From $399/month | Website | |
| 7 | Best for full-stack business intelligence with no coding | Free demo available | Pricing upon request | Website | |
| 8 | Best for providing pre-trained AI models developed by a team of data scientists | Free demo available | Pricing upon request | Website | |
| 9 | Best for conversational, AI-driven insights | Free demo available | Pricing upon request | Website | |
| 10 | Best for translating insights to impact your entire team | Free plan available | From $14/user/month (billed annually) | Website |
-

Prisync
Visit WebsiteThis is an aggregated rating for this tool including ratings from Crozdesk users and ratings from other sites.4.7 -
Expedite Commerce
Visit Website -
QuickBooks Online
Visit WebsiteThis is an aggregated rating for this tool including ratings from Crozdesk users and ratings from other sites.4


Best OLAP Tool Reviews
Below are my detailed summaries of the best OLAP tools that made it onto my shortlist. My reviews offer a detailed look at the key features, pros & cons, integrations, and ideal use cases of each tool to help you find the best one for you.
Instead of revealing data about your internal operations, Toucan is designed as a customer-facing analytics platform to ensure you’re providing the best end-user experience. Toucan provides guided data visualization and an app gallery you can use as a starting point for dashboard customization.
Why I picked Toucan: The thing that I found really cool about this platform was its focus on making data more interesting. With the Storytelling Framework and Guided Design features, you can create professional, engaging reports without needing to code or design.
Toucan Standout Features and Integrations
Standout features include Zero-Click Mobility that allows you to create an application once for access on any device and live data connections with any API-ready cloud data source.
Integrations include Aircall, Amazon Web Services, Azure, Microsoft SQL Server, MicroStrategy, MongoDB, Onedrive, SAP HANA, Snowflake, and Soap.
Pros and Cons
Pros:
- Customer support is friendly and knowledgeable
- It supports many reporting visualization styles
- Versatile software can integrate with any workflow
Cons:
- High learning curve that requires customer support
- Can be daunting to learn initially

Designed to provide you more depth and serve the needs of the largest global enterprises, Tableau can fit in with any data strategy and workflow. Instead of dictating your performance management, it adapts to your environment with more flexibility in no-code queries, interactive data stories, and metadata management.
Why I picked Tableau: I like this OLAP system because it gives you more control over metadata management. With Tableau, you can modify number formats, create data subsets with selected groups of points, combine fields into groups, rename fields, and build new hierarchies.
Tableau Standout Features and Integrations
Standout features include cloud or self-hosted server options, enhanced security with Customer-Managed Encryption Keys (CMEK), and a content migration tool to define and schedule migration plans.
Integrations include Asana, ClickUp, Google Analytics, MATLAB, OptiSigns, Procore, Salesforce Sales Cloud, Smartsheet, SurveyMonkey, and Yodeck.
Pros and Cons
Pros:
- No-code functionality, like drag-and-drop
- A lot of customization options
- Intuitive and easy to use
Cons:
- Lags when interfacing with Big Data
- Some data syncing issues
As an integrated data platform for marketing teams, Adverity specializes in empowering marketers with automated data integration from hundreds of sources, as well as providing a single source of knowledge that reveals the tangible impact of all marketing activities on your business.
Why I picked Adverity: This platform made my list because it was designed for non-technical users, like your marketing team. You can set up automations that enhance and unify your data with no coding required through easy-to-use script templates that automatically transform your data.
Adverity Standout Features and Integrations
Standout features include a data dictionary that’s auto populated to manage metrics and data mapping, as well as built-in data governance to ensure data quality and completeness.
Integrations include Box, Google Ads, Google Analytics, HubSpot Marketing Hub, Instagram, Mailchimp, Microsoft SharePoint, SEMrush, Shopify, and Twitter. The platform offers pre-built API connectors along with customizable universal connectors.
Pros and Cons
Pros:
- Frequent updates and improvements
- Hundreds of integration options
- Easy to use once training is complete
Cons:
- Add-on tools can cost extra
- Some limitations on automations
New Product Updates from Adverity
Adverity Enhances Connectors and Adds TikTok GMV Max
Adverity updates connectors for Amazon Ads, SmartNews Ads, Indeed, and monday.com, and introduces the TikTok GMV Max connector. These updates improve data accuracy, control, and performance across integrations. For more information, visit Adverity’s official site.
 .
.
Domo offers end users a cloud-native data platform that’s designed to go beyond traditional business intelligence analysis with user-friendly dashboards, actionable insights, and data visualizations that anyone can understand. Domo can connect with existing legacy and cloud systems.
Why I picked Domo: This platform made my list because it can incorporate ML and AI into your workflows. With these technologies, you can infuse your existing data with additional insights and ask questions in natural language queries for live analysis that helps you keep up with trends.
Domo Standout Features and Integrations
Standout features include ModelOps to reduce manual work and streamline deployment, as well as business-facing dashboards to share business data with non-technical users.
Integrations include Basecamp, DocuSign, DropBox Business, GitHub, Google Drive, Jira, Mailchimp, Microsoft Excel, SurveyMonkey, and Trello.
Pros and Cons
Pros:
- Android and iOS native apps available
- Over 1,000 pre-built data connectors
- Drag-and-drop ETL capabilities
Cons:
- Customer service reps are mainly non-technical
- No navigation across related objects to retrieve fields in different data sets
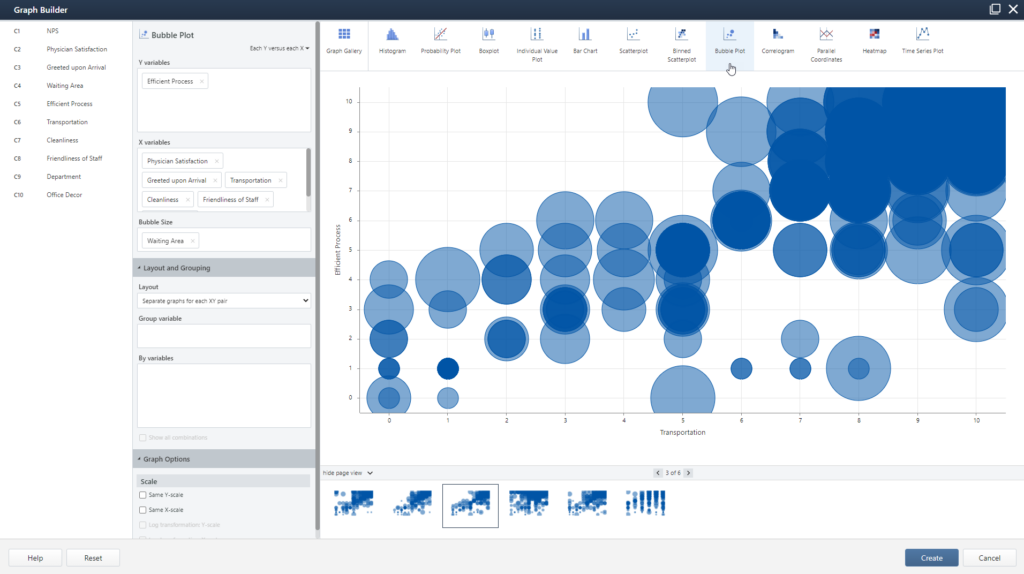
Minitab is a statistical software that integrates with a variety of open-source languages, as well as boosting your capabilities with machine learning algorithms, including TreeNet, Random Forests, and CART. You can also visualize your data in the Graph Builder, exploring any number of graph and chart configurations without re-running your analysis.
Why I picked Minitab: I put this platform on my list because it prioritizes better outcomes for products and processes through key statistical tests. With Minitab, you can run one and two proportions, t tests, chi-square, normality tests, and equivalence tests through their integrated approach.
Minitab Standout Features and Integrations
Standout features include measurement system analysis with gage studies and attribute agreement analysis, variable, time weighted control charts, and design of experiments with screen designs, full factorial, and fractional factoria.
Integrations include Amazon Aurora, Amazon Redshift, Box, CircleBack, Constant Contact, JMP, Microsoft PowerPoint, Microsoft Word, SIMUL8, and WinSPC.
Pros and Cons
Pros:
- Large and knowledgeable support community
- Easy to use and navigate
- Very feature-rich platform
Cons:
- Interface feels a little bit outdated
- No visual or low-code options
As a data and analytics platform, Sisense strives to make it easier for your team to mashup data from across your entire landscape and transform it into actionable analytics that you can embed anywhere, including reports, web pages, and presentations. Sisense offers functionality in the cloud or on-premise, as well as a mix of both to provide more versatility.
Why I picked Sisense: I chose this platform for my list because they have a Notebook feature that allows you to leverage a combination of cached or live data models for optimal performance and resource management. Whether you do ad hoc analysis or build something more advanced, you can prep, cleanse, and perform sophisticated data transformations through SQL queries, R-code, and Python.
Sisense Standout Features and Integrations
Standout features include Git-based workflows to visualize and augment business analytics and scalable data processing for all skill levels, including no code, low code, and full-code.
Integrations include Dropbox Business, Gmail, Google Drive, Microsoft Excel, PayPal, QuickBooks Desktop Enterprise, Mailchimp, Salesforce Sales Cloud, Slack, and SurveyMonkey.
Pros and Cons
Pros:
- Attractive user-interface design
- Highly customizable dashboards and reporting
- Very integratable with common databases
Cons:
- Installation is long and complex
- Customization can be tedious

This no-code BI platform is meant to empower your entire organization to explore data for better decision-making for every team. Grow combines data warehousing, ETL, and visualizations with an OLAP server to help you connect and explore data and surface new insights.
Why I picked Grow: This platform has a few unique features, including automated reporting that keeps your data pipelines fresh with sync schedules that refresh your dashboards and other reports as the information changes. Customize your KPIs and metrics to see the things you truly care about.
Grow Standout Features and Integrations
Standout features include an OLAP database where you can access reusable data tables from multiple data sources and permissions-based control to authorize and assign raw stored tables.
Integrations include Dropbox, Facebook Ads, Google Ads, Google Analytics, Google Sheets, HubSpot, Instagram Business, MySQL, PostgreSQL, and Stripe.
Pros and Cons
Pros:
- Knowledgeable customer support team
- Dashboards are easy to read
- Unlimited user license pricing model for better budgeting
Cons:
- Limited export capabilities
- Doesn’t offer all BI capabilities
Reveal
Best for providing pre-trained AI models developed by a team of data scientists
As a web-based eDiscovery software, Reveal can help your organization find, sort, and store electronic data to gain actionable insights from unstructured or structured datasets with a focus on AI and machine learning technology. This platform focuses on streamlining litigation, configuring workflows, and managing investment processes.
Why I picked Reveal: One standout feature from this platform is the pre-generated AI models that are designed by the in-house data scientist team. You can access out-of-the-box solutions, including data cleanup, toxic work environment detection, privileged document detection, and sexual harassment detection.
Reveal Standout Features and Integrations
Standout features include large language models for predictive content generation and legal hold management for discrete data preservation.
Integrations include NexLP.
Pros and Cons
Pros:
- Lots of built-in features
- Intuitive navigation and interface
- Can be used in a cloud environment
Cons:
- Can’t print directly from the platform
- Pre-defined reports could be better

Athenic is an AI-powered online analytical processing (OLAP) tool designed to make data exploration faster and more intuitive. It allows users to run natural language queries, visualize insights, and create dynamic dashboards without requiring deep technical expertise. Its conversational interface and autonomous analysis capabilities make it suitable for teams that need quick, accurate answers across large datasets.
Why I Picked Athenic: I picked Athenic because it simplifies complex data analysis through a conversational interface. Instead of relying on manual SQL queries, you can ask questions in natural language and receive instant insights, tables, and visualizations. I also like that Athenic uses a Knowledge Graph to connect data points, making exploratory analysis more accurate and contextual. Additionally, its autonomous research capabilities save time by proactively generating reports and deeper insights for decision-making.
Athenic Standout Features and Integrations
Standout features include custom AI models tailored to specific business needs, autonomous report generation for faster decision-making, and a secure business intelligence framework that prioritizes data privacy. The platform also supports advanced data visualization tools for building interactive dashboards and sharing insights across teams.
Integrations include Google Sheets, Slack, Gmail, Trello, ClickUp, Airtable, Salesforce CRM, HubSpot, Monday.com, OpenAI (ChatGPT), Facebook, Instagram, Google Analytics, MySQL, PostgreSQL, Twilio, Typeform, Zoho CRM, and over 50 additional tools for seamless connectivity.
Pros and Cons
Pros:
- Functions as an AI-powered English-to-SQL translator, enhancing data querying
- Supports product and customer growth planning
- User-friendly interface simplifies data analysis for non-technical users.
Cons:
- Limited features compared to more advanced analytics tools
- Requires internet access for optimal functionality
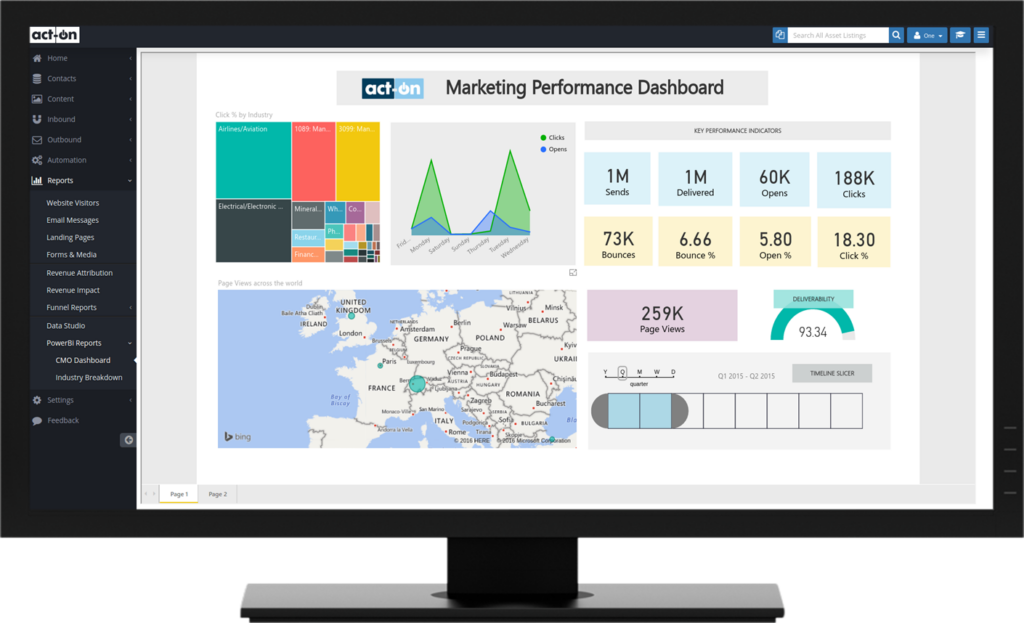
This suite of analytics tools is customizable with pre-built dashboards that help you unify important metrics and show real-time updates on every device. Microsoft Power BI delivers a centralized source of knowledge that connects organizational data while Power BI for Windows delivers report authoring features and local data mashup data. You can then query the data using natural language.
Why I picked Microsoft Power BI: One unique feature from this platform is the Copilot feature, which helps you uncover insights faster. You simply describe what you need, including calculations, reports, or narrative summaries, and ask a question about your data. Copilot will do all the work, pulling, analyzing, and visualizing the right information.
Microsoft Power BI Standout Features and Integrations
Standout features include semantic models that empower you to combine self-service and enterprise analytics, as well as industry-leading AI that helps non-data scientists prep data and find insights.
Integrations include ActivTrak, MATLAB, Microsoft Suite, OptiSign, QuickBooks Online, Reach, Smartsheet, UpKeep, Xero, and Yodek.
Pros and Cons
Pros:
- Easy to integrate data sources
- Robust collaboration tools for sharing
- Easy to learn how to make custom reports
Cons:
- No data cleansing solution
- Steep learning curve for non-BI users
Other OLAP Tools
Here are some additional OLAP tools options that didn’t make it onto my shortlist, but are still worth checking out:
- Sisense
For building intelligent analytics into products
- Adverity
Centralized data management for marketing teams
- Toucan
For data storytelling for your customers
- Style Intelligence
For Mashup-driven dashboards
- icCube
Embedded analytics solution for SaaS
- SplashBI
All-in-one framework to drive efficiency
- Looker
For self-service, governed, and embedded business intelligence tools
- Databox
For building custom dashboards and reports with thousands of metrics
- Integrate.io
For designing a no-code data pipeline for data teams
- Qlik Sense
For transforming your organization through the democratization of BI
- OriginPro
For graphing data for science and engineering needs
- Pentaho
For full-solution functionality with optimization, integration, and analytics
- IBM Cognos
For data accessibility through a natural language AI assistant
- Qlik Sense
For transforming your organization through the democratization of BI
- Apache Kylin
Analytical data warehouse for big data


OLAP Tool Selection Criteria
When selecting the best OLAP tools to include in this list, I considered common buyer needs and pain points like data integration challenges and scalability issues. I also used the following framework to keep my evaluation structured and fair:
Core Functionality (25% of total score)
To be considered for inclusion in this list, each solution had to fulfill these common use cases:
- Data aggregation
- Multidimensional analysis
- Drill-down capabilities
- Real-time data processing
- Reporting and visualization
Additional Standout Features (25% of total score)
To help further narrow down the competition, I also looked for unique features, such as:
- AI-driven insights
- Customizable dashboards
- Integration with third-party tools
- Advanced security features
- Cloud-based scalability
Usability (10% of total score)
To get a sense of the usability of each system, I considered the following:
- Intuitive interface
- Easy navigation
- Customizable layouts
- User-friendly design
- Minimal learning curve
Onboarding (10% of total score)
To evaluate the onboarding experience for each platform, I considered the following:
- Availability of training videos
- Interactive product tours
- Pre-built templates
- Access to webinars
- Responsive chatbots
Customer Support (10% of total score)
To assess each software provider’s customer support services, I considered the following:
- 24/7 availability
- Multiple support channels
- Response time
- Knowledgeable staff
- Comprehensive FAQ section
Value For Money (10% of total score)
To evaluate the value for money of each platform, I considered the following:
- Competitive pricing
- Flexible pricing plans
- Cost vs. features offered
- Discounts for annual subscriptions
- Free trial availability
Customer Reviews (10% of total score)
To get a sense of overall customer satisfaction, I considered the following when reading customer reviews:
- Overall satisfaction rating
- Frequency of updates
- User feedback on features
- Comments on reliability
- Opinions on customer service
How to Choose OLAP Tool
It’s easy to get bogged down in long feature lists and complex pricing structures. To help you stay focused as you work through your unique software selection process, here’s a checklist of factors to keep in mind:
| Factor | What to Consider |
|---|---|
| Scalability | Will the tool grow with your business? Consider your data volume and user base. Look for solutions that can handle increasing demands without performance loss. |
| Integrations | Does it connect with your existing systems? Check for compatibility with your CRM, ERP, and other essential software to ensure seamless data flow. |
| Customizability | Can you tailor the tool to your processes? Look for options that allow for custom reports and dashboards to fit your team's specific needs. |
| Ease of use | Is the interface intuitive? Ensure your team can adopt the tool quickly without extensive training. Look for simple navigation and clear instructions. |
| Implementation and onboarding | How long will it take to get started? Assess the setup time and available resources like training videos or customer support to aid the transition. |
| Cost | Is it within your budget? Compare pricing plans and consider the total cost of ownership, including potential hidden fees or additional costs for extra features. |
| Security safeguards | Does it protect your data? Ensure the tool complies with security standards like encryption and access controls to keep your information safe. |
Trends In OLAP Tools For 2026
OLAP tools are essential for dissecting large volumes of data, enabling organizations to derive actionable insights and make informed decisions swiftly. The latest trends in OLAP tools underscore a shift towards more advanced analytics, user-friendly interfaces, and integration capabilities, aligning with the dynamic needs of revenue operations management.
Integration with Advanced Analytics and AI:
- OLAP tools are increasingly incorporating AI and machine learning algorithms to enhance data analysis, offering predictive insights and automated anomaly detection.
- The integration of AI facilitates more sophisticated data modeling and forecasting, enabling users to anticipate market trends and make proactive decisions.
Enhanced Data Visualization and Interactive Reporting:
- There is a notable shift towards more intuitive data visualization capabilities, allowing users to comprehend complex information quickly and share insights across the organization.
- Interactive reporting features are evolving to enable users to drill down into specifics, customize views, and dynamically explore data from multiple angles.
Increased Emphasis on Collaboration Features:
- Collaboration tools are being integrated into OLAP platforms, enabling teams to work together on data analysis, share insights, and streamline decision-making processes.
- These features address the need for agile, cross-functional collaboration in fast-paced business environments, ensuring that key insights are effectively communicated and acted upon.
Scalability and Cloud Integration:
- OLAP tools are offering enhanced scalability options to manage vast data sets and user bases without compromising performance.
- Cloud-based OLAP solutions are becoming more prevalent, providing flexibility, reducing infrastructure costs, and facilitating remote access to data and analytical tools.
Declining Features:
- Traditional, static reporting is diminishing in favor of dynamic, real-time analysis capabilities.
- Isolated OLAP systems that lack integration with broader business intelligence and data ecosystems are losing favor, as businesses seek more interconnected analytical solutions.
These trends reflect the overarching needs and challenges faced by revenue operation leaders, emphasizing the demand for OLAP tools that provide deeper insights, foster collaboration, and adapt to the changing data landscape. As organizations strive to harness the full potential of their data for revenue optimization, the role of advanced OLAP tools becomes increasingly central, offering a blend of powerful analytics, user-centric design, and operational efficiency.
What Are OLAP Tools?
OLAP tools are software that let you analyze big sets of data from different angles. Business analysts, data scientists, and decision-makers use these for slicing and dicing information—think spotting trends or drilling down into key numbers. With OLAP tools, you can look at data across multiple dimensions, which helps you answer tough business questions faster and more clearly.
Features of OLAP Tools
When selecting OLAP tools, keep an eye out for the following key features:
- Data modeling: OLAP tools let you organize and structure complex data from multiple sources, so you can easily create multidimensional models that suit your business needs and help you see the big picture.
- Ad hoc query capabilities: You can quickly build and run your own custom queries on the fly, which means digging into your data without waiting for help from IT every time you have a new question.
- Drill-down and roll-up: These features allow you to zoom in to see details or step back for summary views, making it much smoother to follow a data trail from a big-picture trend down to the granular numbers behind it.
- Pivoting and slicing: You can pivot data to rearrange how you view dimensions, or slice it to filter for specific subsets—both make it simple to look at your information from every possible angle.
- Aggregation functions: OLAP tools carry built-in tools for calculating sums, averages, counts, and more, so you can get meaningful insights without crunching numbers manually.
- Security and access control: You get control over who sees what, ensuring the right people have access to sensitive data while keeping information protected from those who shouldn’t.
- Data visualization: Many OLAP tools offer dashboards, charts, and graphs, turning raw numbers into engaging visuals and making your findings clearer to anyone—even those who might run away from a spreadsheet.
- Performance optimization: These tools are built to handle massive data sets and complex calculations quickly, so you don’t have to wait forever for your reports or analyses to finish.
- Integration capabilities: OLAP tools typically play well with other systems, allowing you to pull in or export data from various business applications to streamline your workflow.
Common OLAP Tools AI Features
Beyond the standard OLAP tools features listed above, many of these solutions are incorporating AI with features like:
- Automated trend detection: AI scans your data for patterns or anomalies you may have missed, spotting shifts or outliers without you lifting a finger.
- Predictive analytics: Machine learning models forecast future outcomes based on your current data, helping you make better decisions before things happen.
- Natural language query: Instead of memorizing complex query builders, you can just ask questions in plain English and let the AI translate for you.
- Smart data preparation: AI suggests ways to clean, organize, and enrich your data automatically, saving you loads of manual prep work.
- Personalized insights: AI looks at your usage habits and surfaces insights or analysis recommendations tailored to the way you work best.
Benefits of OLAP Tools
Implementing OLAP tools provides several benefits for your team and your business. Here are a few you can look forward to:
- Improved decision-making: Real-time processing and data aggregation provide timely insights, helping you make informed business choices.
- Enhanced data understanding: Multidimensional analysis and drill-down capabilities let you explore data from various angles, improving comprehension.
- Time savings: Customizable dashboards and user-friendly interfaces reduce the time spent on data analysis tasks.
- Adaptability to growth: Scalability ensures the tool can handle increased data and user demands as your business expands.
- Better data security: Security safeguards protect sensitive information, giving you peace of mind about data integrity.
- Increased efficiency: Integration compatibility with existing systems ensures smooth data flow, improving operational efficiency.
- Clear insights: Advanced visualization offers easy-to-understand graphical data representations, aiding in quick insight generation.
Costs & Pricing of OLAP Tools
Selecting OLAP tools requires an understanding of the various pricing models and plans available. Costs vary based on features, team size, add-ons, and more. The table below summarizes common plans, their average prices, and typical features included in OLAP tools solutions:
Plan Comparison Table for OLAP Tools
| Plan Type | Average Price | Common Features |
|---|---|---|
| Free Plan | $0 | Basic data analysis, limited user support, and restricted data storage. |
| Personal Plan | $5-$25/user/month | Multidimensional analysis, customizable dashboards, and basic integration options. |
| Business Plan | $30-$75/user/month | Advanced security features, real-time processing, and enhanced data visualization. |
| Enterprise Plan | $100-$200/user/month | Full integration capabilities, priority customer support, and unlimited scalability. |
OLAP Tools FAQs
Here are some answers to common questions about OLAP tools:
How do OLAP tools handle data storage?
OLAP tools typically store data in a multidimensional database, allowing for efficient querying and analysis. This structure lets you perform complex calculations and analyses quickly. Some tools might integrate with cloud storage solutions to enhance accessibility and scalability, so consider your storage needs when choosing a tool.
Can OLAP tools integrate with my existing software?
Yes, most OLAP tools offer integration capabilities with common software like CRM and ERP systems. Check the tool’s compatibility with your existing systems before purchasing. Seamless integration ensures that data flows smoothly between platforms, enhancing your team’s productivity and data accuracy.
Are OLAP tools suitable for small businesses?
Yes, OLAP tools can be suitable for small businesses, especially those with data-driven decision-making needs. Many tools offer scalable pricing plans, including free and personal tiers, that cater to smaller teams. Evaluate your business’s data analysis requirements and budget to find a tool that aligns with your needs.
How secure are OLAP tools?
OLAP tools usually come with security features like data encryption, user access controls, and compliance with data protection regulations. When selecting a tool, assess its security measures to ensure they meet your organization’s standards. Prioritize tools that offer robust security to protect sensitive business information.
What’s Next:
If you're in the process of researching OLAP tools, connect with a SoftwareSelect advisor for free recommendations.
You fill out a form and have a quick chat where they get into the specifics of your needs. Then you'll get a shortlist of software to review. They'll even support you through the entire buying process, including price negotiations.