

With so many different mobile BI software available, figuring out which is right for you is tough. You know you want to access, analyze, and visualize business data through your mobile devices but need to figure out which tool is best. I've got you! In this post I'll help make your choice easy, sharing my personal experiences using dozens of different mobile BI tools with various teams, with my picks of the best mobile BI software.
Why Trust Our Software Recommendations
6,700+
Reviews
20
Industry experts
16+
Evaluation factors
14
Years
Our reviews reflect our independent judgment—not a sales pitch. Learn how we stay transparent.
For this guide, we evaluated tools using hands-on testing and independent research, scoring tools using our selection criteria.
Our reviews reflect our human editorial judgment, not a sales pitch.
The Best Mobile BI Software Comparison Table
Here is a table you can use to compare the software we just covered in the overviews.
| Tool | Best For | Trial Info | Price | ||
|---|---|---|---|---|---|
| 1 | Best for multi-channel alerts on mobile KPIs | Free trial + demo available | Pricing upon request | Website | |
| 2 | Best for in-app threshold alerts on live dashboards | 7-day free trial + free demo available | Pricing upon request | Website | |
| 3 | Best for MDM-enforced mobile BI governance | Free demo available | Pricing upon request | Website | |
| 4 | Best for governed semantic layer on mobile | 30-day free trial + free demo available | Pricing upon request | Website | |
| 5 | Best for true offline drill-down on mobile | Not available | Pricing upon request | Website | |
| 6 | Best for Pulse metric alerts on the go | 14-day free trial | Pricing upon request | Website | |
| 7 | Best for deploying across any cloud provider | 14-day free trial + free demo available | From $13/user/month | Website | |
| 8 | Best for associative engine analytics on mobile | 30-day free trial | Pricing upon request | Website | |
| 9 | Best for Microsoft-stack mobile data collaboration | Free plan available | From $14/user/month (billed annually) | Website | |
| 10 | Best for AI-driven mobile KPI alerts and governance | 14-day free trial + free demo available | From $25/user/month (billed annually) | Website |


Best Mobile BI Software Reviews
Are you ready to take a deep dive into the top mobile business intelligence tools? Take a look at each software on my list to find an overview of their functionality, a few standout features and integrations, pricing and trial offers, and several pros and cons to help you narrow down your options.
 1Best for multi-channel alerts on mobile KPIs
Domo
- Free trial + demo available
- Pricing upon request
Visit WebsiteCustomer Rating:4.4/5This rating combines scores from multiple user review sites to reflect overall customer sentiment about the product.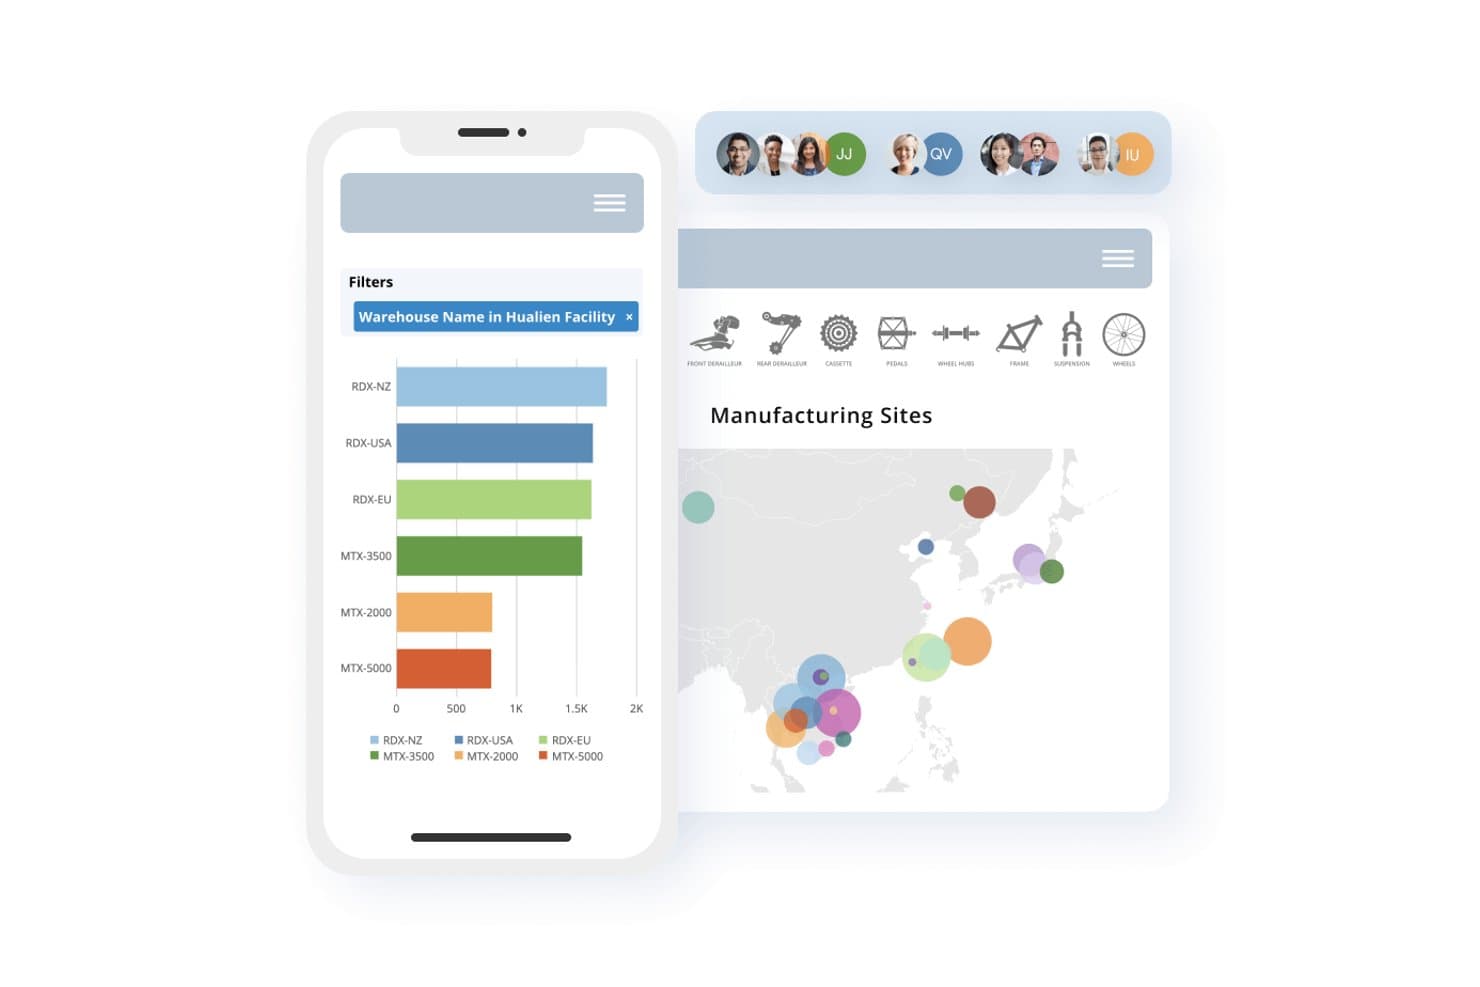
Domo delivers mobile BI dashboards for supply chain and manufacturing insights. Domo is a cloud BI platform with native iOS and Android apps that lets you consume dashboards, run self-service analysis, and receive multi-channel KPI alerts across your connected data sources.
Who Is Domo Best For?
Domo suits large sales and revenue operations teams that need to push KPI alerts across multiple channels to big groups of field reps and managers.
Why I Picked Domo
I picked Domo as one of the best because its multi-channel Alert Center is genuinely best-in-class for revenue teams tracking quota attainment and deal movement. When a threshold triggers, alerts fire across push, SMS, email, and phone simultaneously, so field reps catch critical KPI shifts whether they're in a meeting or on a plane. I also like that admins can configure role-specific mobile navigation per user group, so a regional sales manager sees exactly the pipeline cards they need without digging through irrelevant dashboards.
Domo Key Features
- Mobile app navigation configuration: Admins can build custom bottom tab bars and navigation layouts per user group, so each role sees only the dashboards relevant to their work.
- AI Chat on mobile: Available on iOS and Android, AI Chat lets users ask natural-language questions and get generated visualizations directly from their phone.
- Salesforce writeback connector: Domo can push updated data from a DataSet back into Salesforce, keeping CRM records in sync without manual exports.
- Credit Utilization dashboard: A built-in dashboard tracks credit consumption in real time, giving RevOps teams visibility into platform usage and cost before overages hit.
Domo Integrations
Domo offers 1,000+ connectors, including Salesforce, Snowflake, Google BigQuery, Databricks, Redshift, and MySQL. It also supports REST APIs, a custom connector SDK, Salesforce writeback, Microsoft Teams AI Chat, and warehouse-native data architectures.
Pros and Cons
Pros:
- Mobile AI chat with natural language queries
- Customizable navigation for each user group
- Multi-channel alerts on mobile KPIs
Cons:
- No MDM certifications for mobile security
- Complex consumption-based licensing cost model
Learn more about Domo: Best for in-app threshold alerts on live dashboards
- 7-day free trial + free demo available
- Pricing upon request
Visit WebsiteCustomer Rating:4.4/5This rating combines scores from multiple user review sites to reflect overall customer sentiment about the product.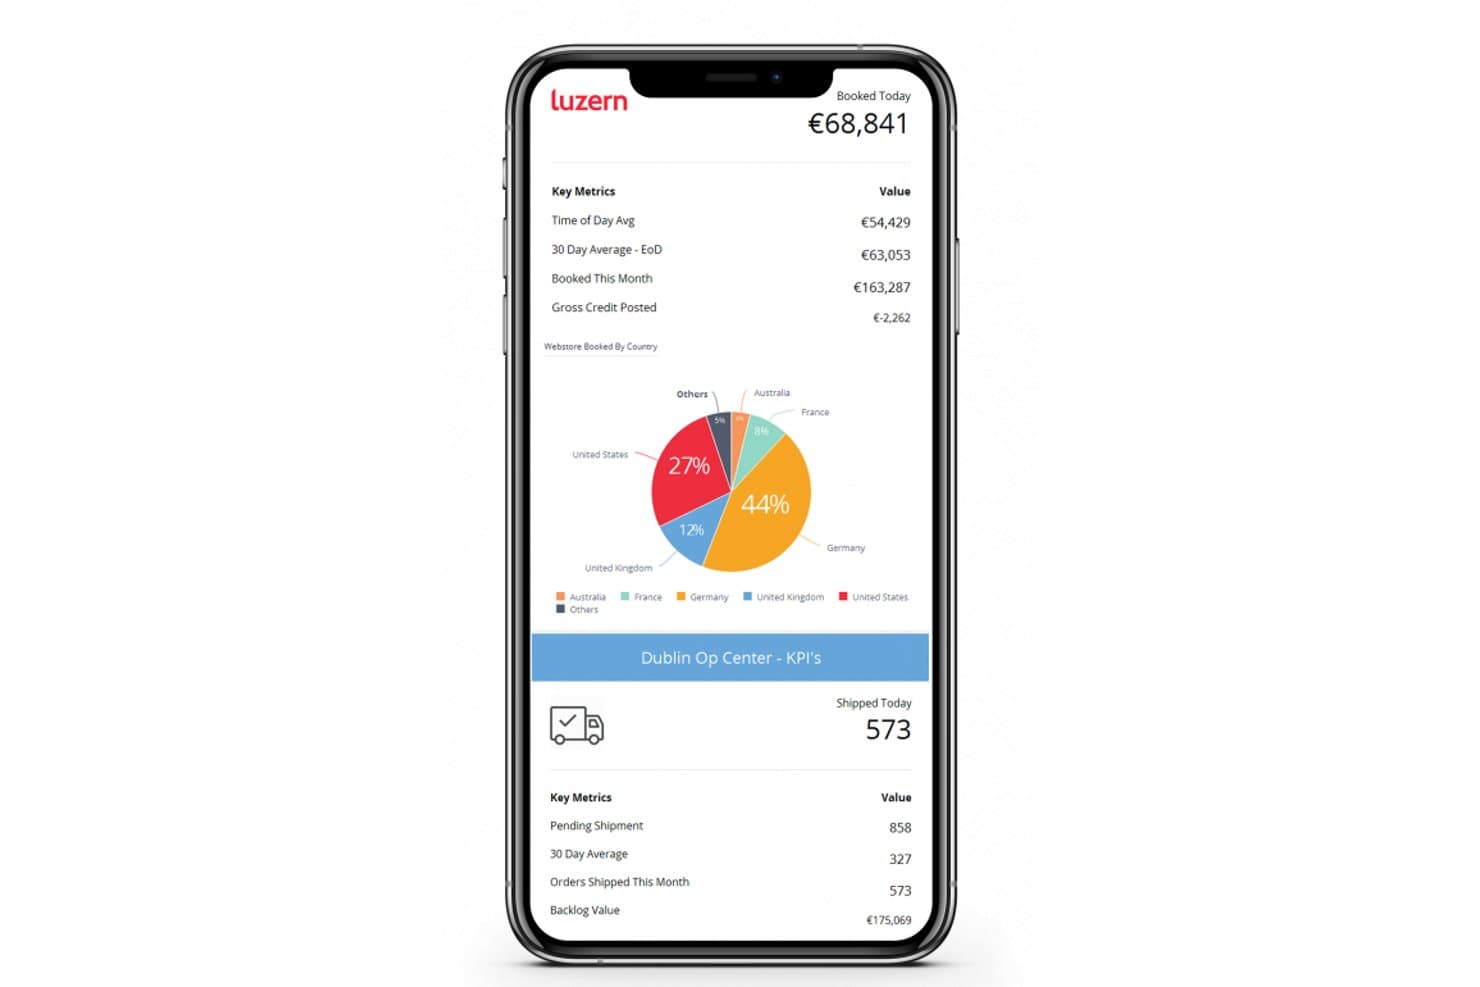
Sisense delivers real-time booking and shipping KPIs on mobile. Sisense is a BI and embedded analytics platform with native iOS and Android apps that support live dashboard viewing, multi-source data connectivity, interactive drill-downs, and in-app threshold alerting via Sisense Pulse.
Who Is Sisense Best For?
Sisense is a strong fit for BI and analytics teams at mid-to-large organizations that need to embed governed dashboards and threshold alerts directly into their product or internal workflows.
Why I Picked Sisense
Sisense earns its spot on my shortlist because of how well Sisense Pulse handles in-app threshold alerting on live dashboards. I can create an alert directly from a widget value inside the mobile app, define the trigger condition, and get a push notification with data-change history that deep-links straight into the relevant dashboard. I also like that the native iOS and Android apps support drill-down and Jump-to-Dashboard in a full-screen widget view, so the alert isn't just a notification—it's a starting point for actual analysis.
Sisense Key Features
- ElastiCube multi-source blending: Combine data from multiple sources—including Salesforce, HubSpot, and cloud warehouses—into a single in-memory model for fast dashboard queries.
- Row- and column-level security: Access controls enforced at the query layer ensure users only see the data their role permits, across both desktop and mobile.
- White-label mobile app: Sisense offers a branded mobile app build that organizations can publish to the App Store and Google Play under their own name.
- Jump-to-Dashboard navigation: From any widget's detailed view in the mobile app, users can tap through to a related dashboard without leaving the mobile interface.
Sisense Integrations
Sisense offers 200+ data connectors, including certified integrations with Salesforce and HubSpot, plus connections to Snowflake, Amazon Redshift, Google BigQuery, and Azure Synapse. Compose SDK and REST APIs support custom integrations.
Pros and Cons
Pros:
- White-label mobile app available for branding
- Drill-down and jump-to-dashboard navigation
- True in-app alert creation on mobile
Cons:
- App store reviews cite mobile usability issues
- No documented offline mobile access
Learn more about Sisense: Best for MDM-enforced mobile BI governance
- Free demo available
- Pricing upon request
Visit WebsiteCustomer Rating:4/5This rating combines scores from multiple user review sites to reflect overall customer sentiment about the product.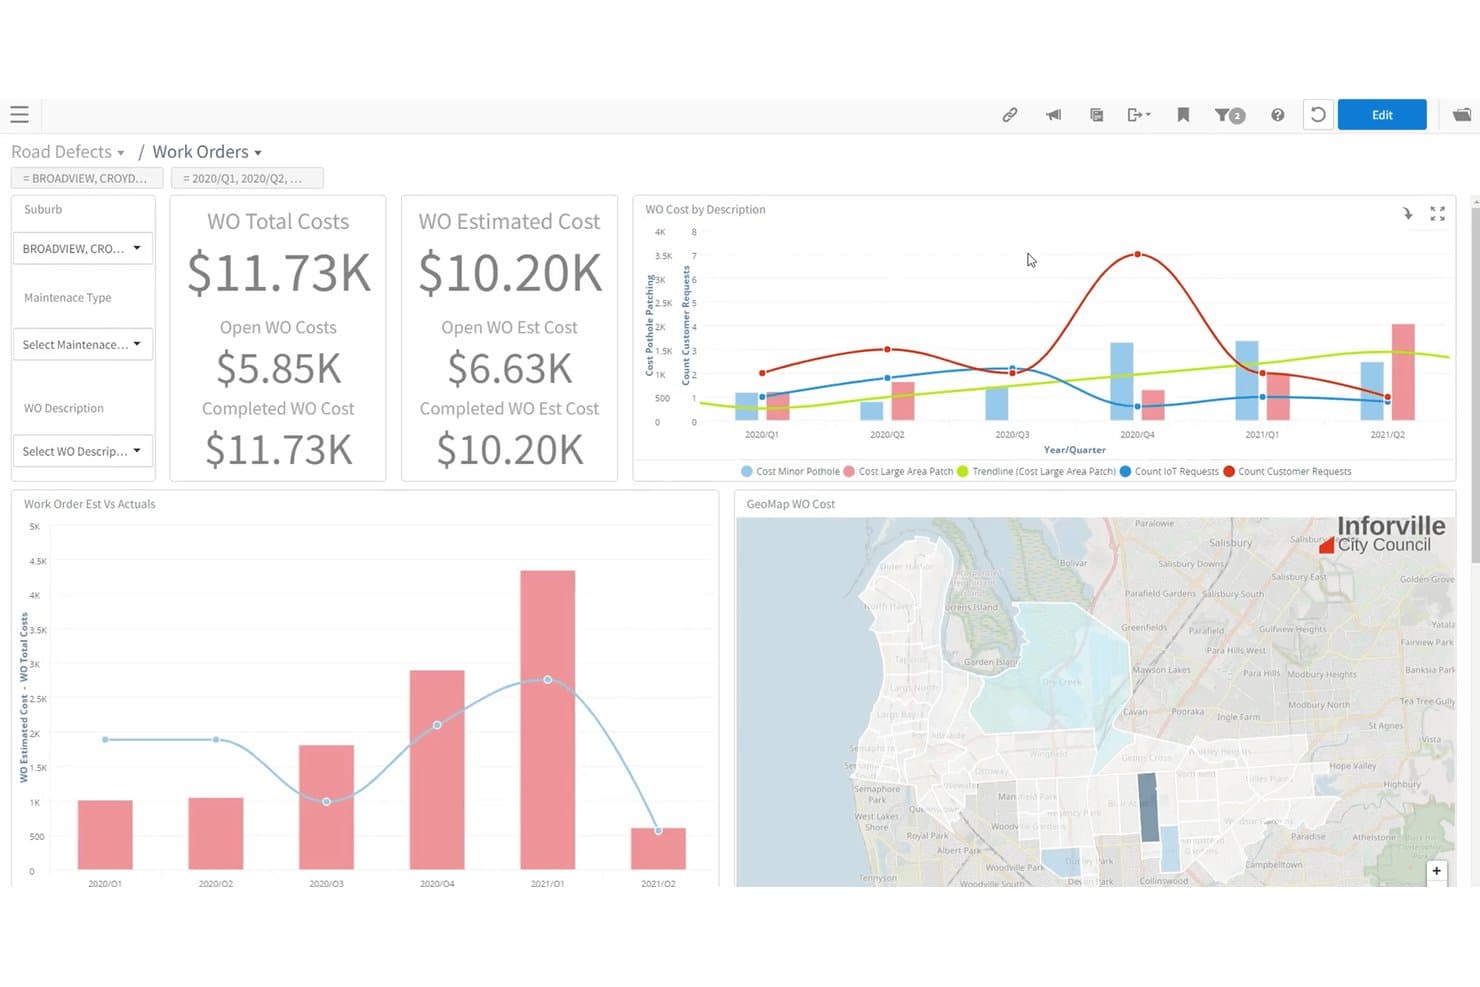
Birst lets users monitor road defect work orders via mobile-ready dashboards. Infor Birst is a cloud BI and analytics platform with native iOS and Android mobile apps that delivers interactive dashboards, offline data access, semantic modeling, and MDM-enforced mobile security controls.
Who Is Birst Best For?
Birst is a strong fit for IT and BI teams in Infor ERP environments that need strict mobile data governance, including MDM enforcement, remote wipe, and jailbreak detection.
Why I Picked Birst
Birst earns its spot on my shortlist because no other mobile BI tool I've evaluated matches its depth of MDM enforcement controls. I'm talking about admin-pushed passcode policies that auto-erase data after 10 failed attempts, jailbreak detection that blocks login on compromised devices, and remote wipe that clears all cached dashboard data the moment a lost device reconnects. For IT teams managing field access to sensitive business data, that level of control is rare in a BI platform.
Birst Key Features
- Shared semantic layer: A centralized data modeling layer enforces consistent metric definitions across all dashboards, so every user sees the same numbers regardless of device.
- Live Access querying: Birst can query data directly from your existing data warehouse without replicating it into the platform first, keeping reports current without full data uploads.
- Stories on mobile: Users can capture, annotate, and present dashboard states as Stories directly from the iOS or Android app, then share findings with teammates.
- Deployment flexibility: Birst supports cloud (multi-tenant SaaS), on-premises appliance, and embedded deployment, giving IT teams control over where data lives and how the platform is hosted.
Birst Integrations
Birst has documented integrations with Salesforce, Marketo, Jira, and SAP. It also supports JDBC, Live Access, and Excel, Access, and CSV imports for connecting mobile dashboards to business data.
Pros and Cons
Pros:
- Semantic layer enforces metric consistency everywhere
- Admins control remote wipe and offline rights
- True native mobile apps for iOS and Android
Cons:
- Offline dashboards only work on iOS devices
- No push or anomaly alerts on mobile
Learn more about Birst: Best for governed semantic layer on mobile
- 30-day free trial + free demo available
- Pricing upon request
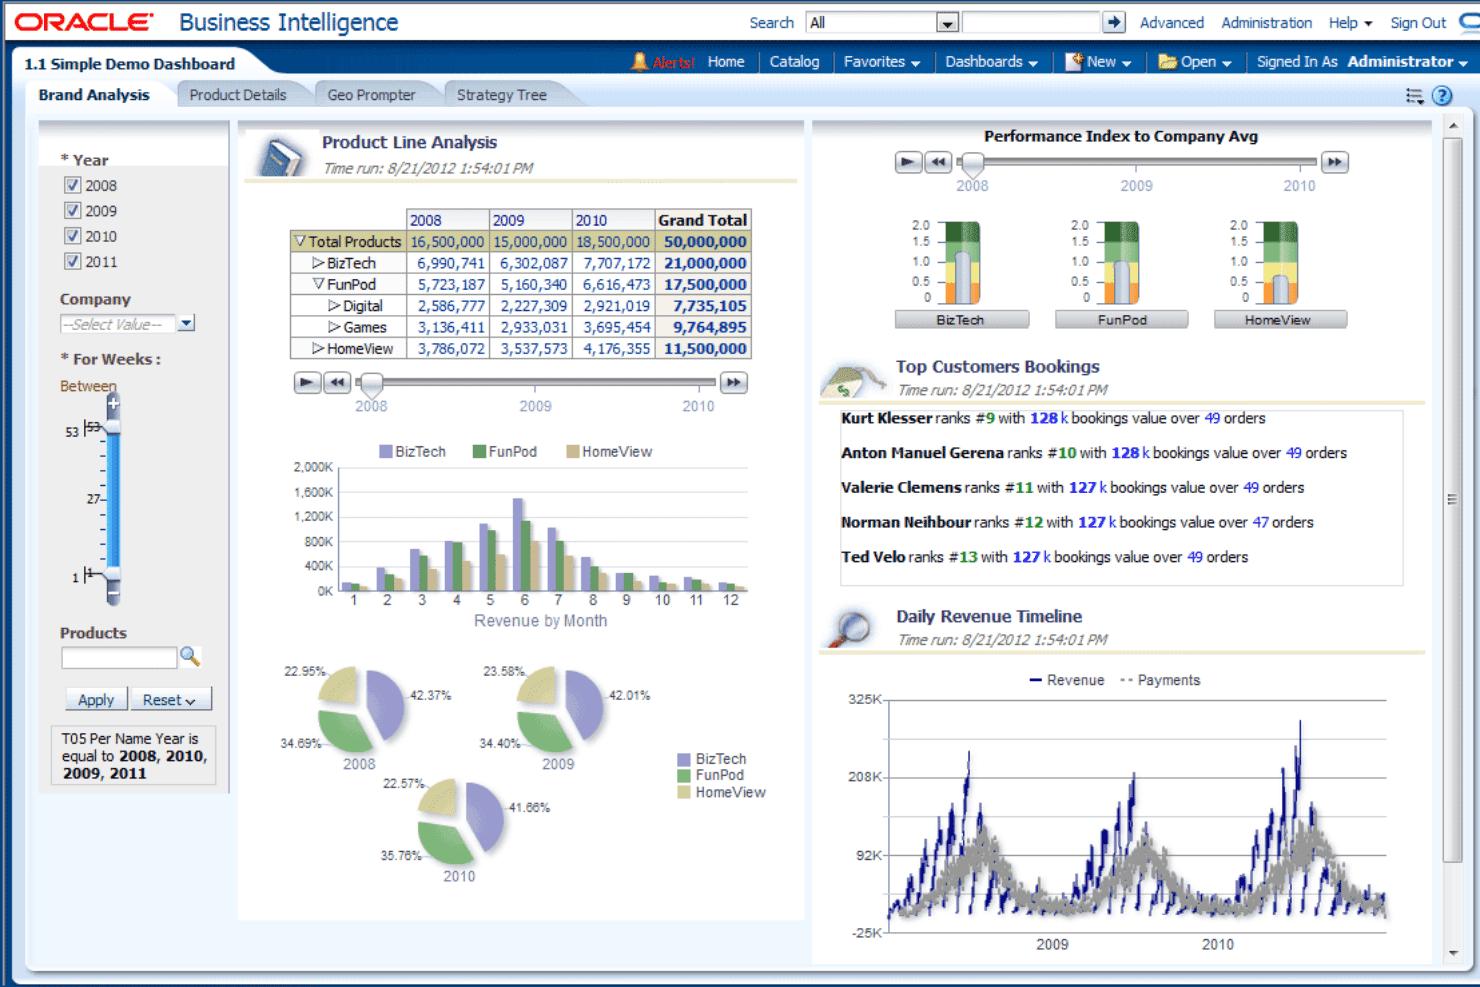
Oracle Business Intelligence centralizes sales and revenue analytics in one dashboard. Oracle Business Intelligence is an enterprise BI platform that delivers governed semantic modeling, interactive dashboards, pixel-perfect reporting, proactive alerting, and native mobile analytics apps for iOS and Android.
Who Is Oracle Business Intelligence Best For?
Oracle Business Intelligence suits large enterprises already running an Oracle stack that need strict, IT-governed data definitions enforced consistently across desktop and mobile.
Why I Picked Oracle Business Intelligence
I've included Oracle Business Intelligence in my top picks because its governed semantic layer enforces a single, IT-certified definition of every metric across both desktop and mobile, so field users never see a different revenue number than headquarters does. I love that existing OBIEE dashboards deploy to the mobile app without any rework, and the BI Mobile Security Toolkit's AppConfig support lets MDM tools push SSL, SSO, and screenshot controls silently to every device.
Oracle Business Intelligence Key Features
- Voice query search: Find and navigate BI content hands-free using voice input directly within the mobile app.
- BI Publisher report viewing: Access pixel-perfect enterprise reports rendered as inline PDFs from your mobile device.
- Geo-spatial visualization: Interact with layered map-based analytics and location data through touch gestures on mobile.
- Action framework: Initiate business processes and take action on analyses and dashboards directly from your mobile device.
Oracle Business Intelligence Integrations
Documented integrations include Oracle Database, Essbase, Teradata, Microsoft SharePoint, and Microsoft Office. Oracle Analytics also supports 35+ native connectors and a generic JDBC connector.
Pros and Cons
Pros:
- AppConfig lets IT manage security remotely
- Voice search and geo-visualizations on mobile
- Strict semantic layer enforces metric consistency
Cons:
- No in-app collaboration or push alerts
- Slower query response on large datasets
Learn more about Oracle Business Intelligence: Best for true offline drill-down on mobile
- Not available
- Pricing upon request
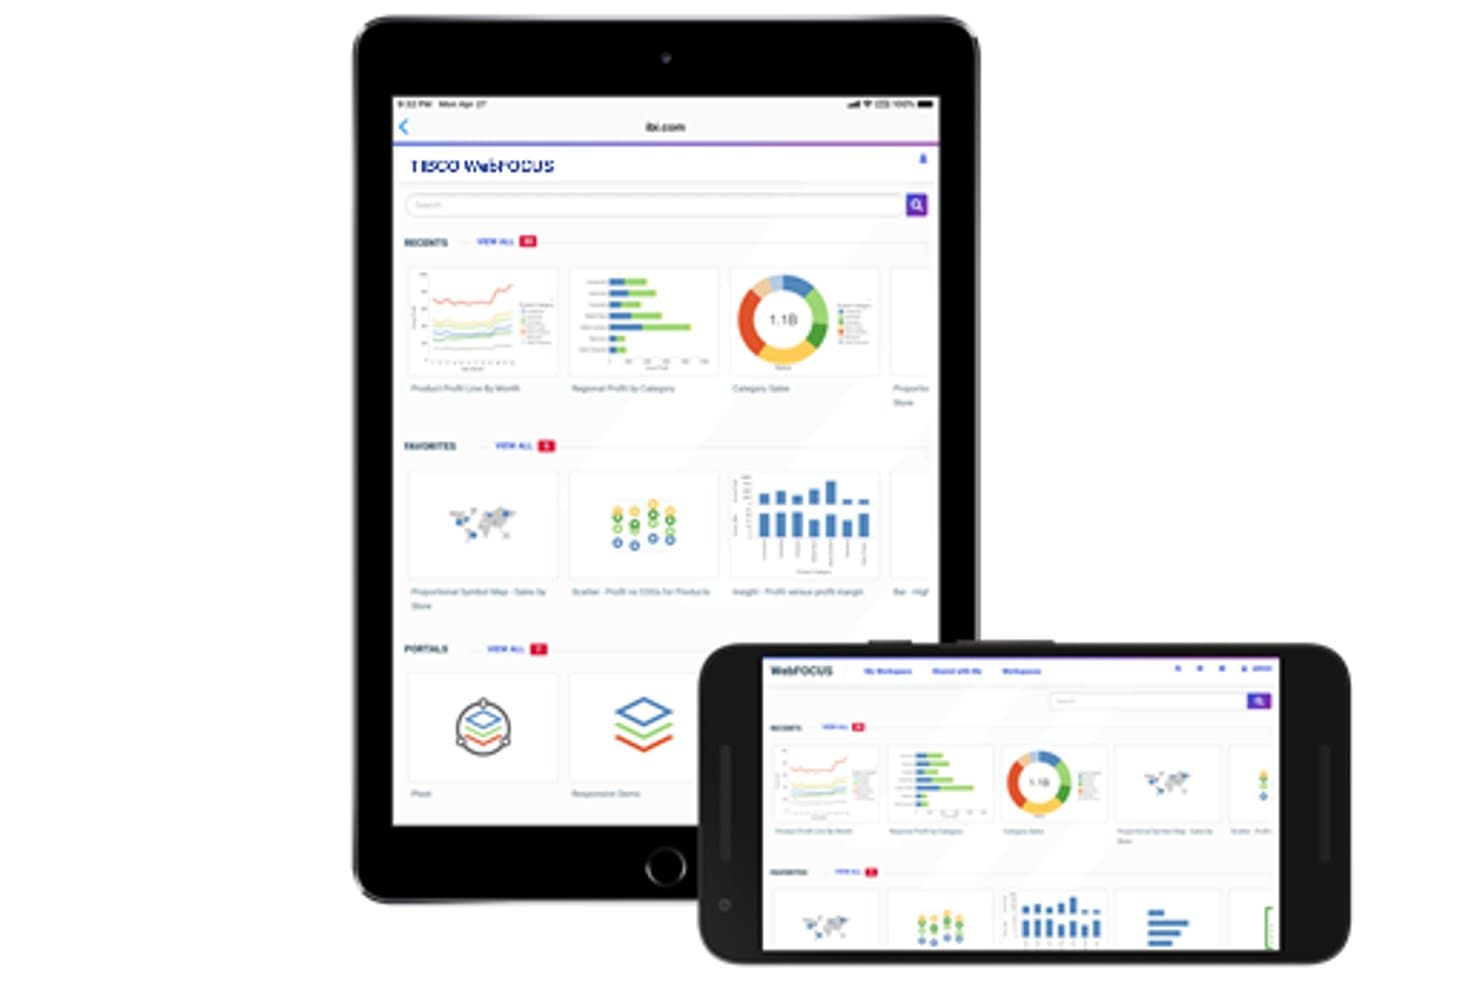
TIBCO WebFOCUS Platform delivers BI dashboards across tablet and mobile devices. WebFOCUS Platform is an enterprise BI and analytics platform that combines pixel-perfect reporting, ad hoc analysis, responsive dashboards, and offline-capable mobile analytics across iOS and Android.
Who Is WebFOCUS Platform Best For?
WebFOCUS Platform is a strong fit for enterprise BI teams that need analysts and field users to explore data fully, even without a network connection.
Why I Picked WebFOCUS Platform
I picked WebFOCUS Platform because its offline drill-down capability is genuinely rare among mobile BI tools. Using Active Technologies, users can sort, filter, drill down, and roll up data with full interactivity, no network connection required. I find this especially valuable for field analysts in low-connectivity environments who still need to explore data beyond a static snapshot, not just view a frozen report.
WebFOCUS Platform Key Features
- Responsive container design: Authors can build dashboards that automatically adapt to desktop, tablet, and mobile screen sizes, with the option to show or hide specific content per device type.
- ReportCaster scheduled distribution: Reports and dashboards can be automatically delivered on a schedule to email, AWS S3, Microsoft SharePoint, FTP, or a report library.
- Row-level DBA security: Administrators can apply granular data access rules that restrict what individual users see down to the row level across any connected data source.
- ibi AI Assistant: An embedded, model-agnostic AI engine that supports natural language queries and automated visual report creation directly within the platform.
WebFOCUS Platform Integrations
WebFOCUS Platform has native adapters for Salesforce, Snowflake, and MongoDB, plus JDBC/ODBC connectivity. It connects to Microsoft SharePoint and AWS S3 for distribution and offers REST and JavaScript APIs for custom integrations.
Pros and Cons
Pros:
- Granular row-level security controls on mobile
- Responsive dashboards adapt automatically to devices
- True offline mobile drill-down and filtering
Cons:
- Mobile app updates and features lag competitors
- No native mobile push notifications
Learn more about WebFOCUS Platform: Best for Pulse metric alerts on the go
- 14-day free trial
- Pricing upon request
Visit WebsiteCustomer Rating:4.5/5This rating combines scores from multiple user review sites to reflect overall customer sentiment about the product.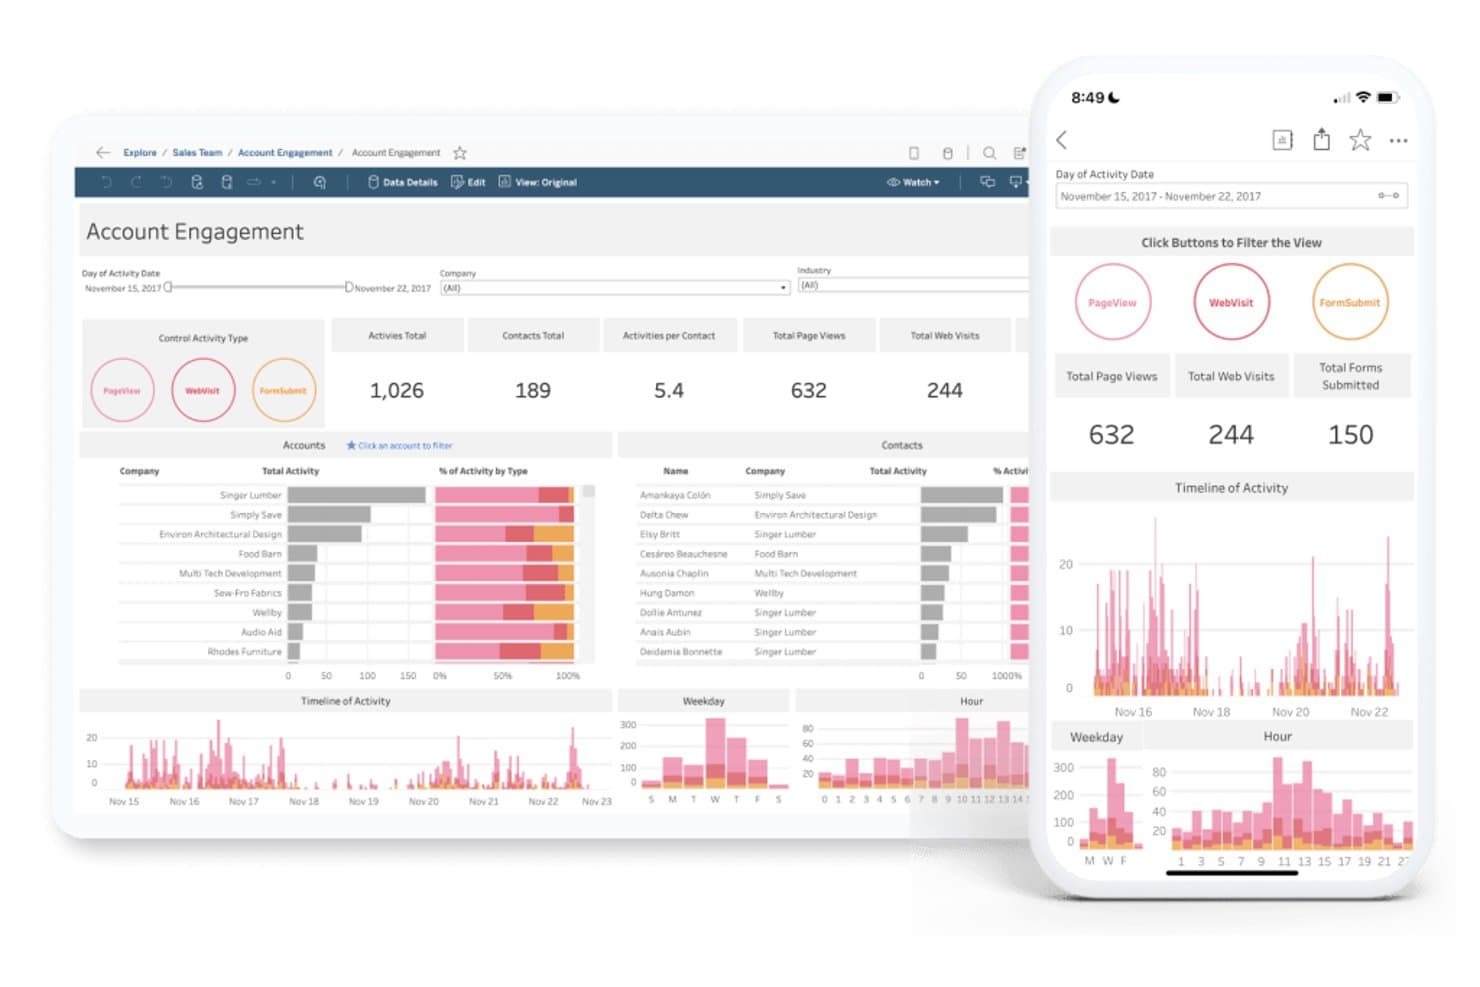
Tableau lets users view engagement dashboards on mobile devices. Tableau is an enterprise BI platform that delivers interactive dashboards, AI-driven metric monitoring via Tableau Pulse, and mobile-optimized visualizations across iOS and Android through its native Tableau Mobile app.
Who Is Tableau Best For?
Tableau is a strong fit for enterprise BI and analytics teams that need a governed, multi-source metrics layer with reliable mobile alerting for revenue and pipeline KPIs.
Why I Picked Tableau
Tableau earns its spot on my shortlist because of how well Tableau Pulse handles metric monitoring on mobile. I particularly like that push notifications fire the moment a KPI moves unfavorably, whether that's a pipeline threshold breach or a revenue trend reversal, and you can mute individual metrics so alerts stay signal, not noise. Home-screen widgets for favorite Pulse metrics mean your most-watched numbers are visible before you even open the app.
Tableau Key Features
- Device Designer: Authors can build separate phone, tablet, and desktop dashboard layouts from a single workbook, giving you precise control over how content renders on each screen size.
- Interactive offline previews: Favorited dashboards are cached locally so you can view and interact with them without a connection, and the app syncs to live data automatically when you reconnect.
- Snowflake OAuth on mobile: Native OAuth authentication for Snowflake lets users access warehouse-connected dashboards directly from the app without additional credential workarounds.
- Microsoft Teams and Slack digest delivery: Tableau Pulse sends metric digests and alerts through Teams and Slack, with one-click deep links that open directly in the mobile app.
Tableau Integrations
Tableau offers native integrations with Salesforce, Snowflake, Google BigQuery, Amazon Redshift, Databricks, PostgreSQL, MySQL, Slack, and Microsoft Teams. Its connector library also supports many additional databases, warehouses, and SaaS data sources.
Pros and Cons
Pros:
- Home-screen widgets show top KPI metrics
- Device Designer controls dashboard mobile layouts
- Push alerts trigger for metric changes
Cons:
- Offline previews require manual favoriting
- No authoring or editing features on mobile
Learn more about Tableau: Best for deploying across any cloud provider
- 14-day free trial + free demo available
- From $13/user/month
Visit WebsiteCustomer Rating:4.2/5This rating combines scores from multiple user review sites to reflect overall customer sentiment about the product.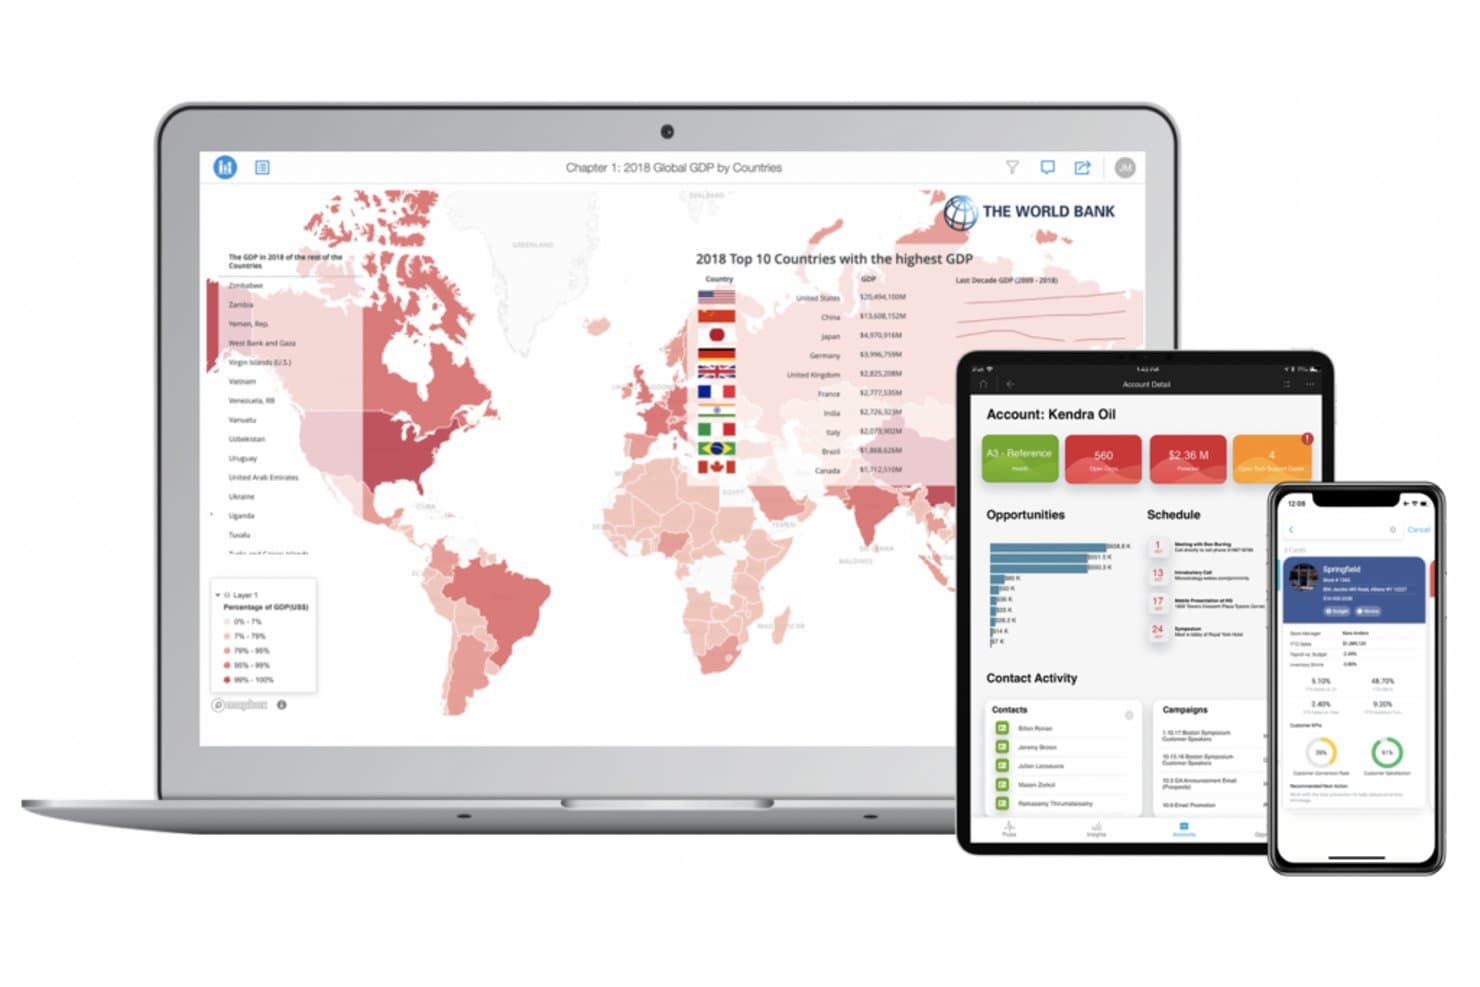
Strategy delivers BI dashboards across desktop, tablet, and mobile devices. Strategy is a mobile BI platform that delivers interactive dashboards, offline data access, push alerts, geospatial visualizations, and write-back capabilities across iOS and Android through multiple purpose-built native apps.
Who Is Strategy Best For?
Strategy is a strong fit for enterprise BI and analytics teams that need to deploy a governed, multi-cloud mobile analytics environment across their preferred cloud infrastructure.
Why I Picked Strategy
Strategy earns its spot on my shortlist because no other mobile BI vendor matches its flexibility for enterprise teams that need to deploy across AWS, Azure, or a private cloud without rewriting their metric logic. I'm particularly impressed by the Mosaic semantic layer, which maintains governed definitions, fiscal calendars, and drill paths regardless of which cloud you're running on. On top of that, the "deploy to any hyperscaler" architecture on the Enterprise plan means your mobile dashboards, offline caches, and push alerts follow your infrastructure, not the other way around.
Strategy Key Features
- Write-back from mobile: Transaction Services let you update ERP and CRM records directly from your phone without switching apps.
- Barcode and QR scanning: The built-in barcode reader prompt lets field users scan items with their device camera to pull up relevant reports instantly.
- HyperIntelligence meeting cards: HyperMobile surfaces contextual data cards tied to your upcoming calendar meetings, so you walk in with the right numbers.
- Natural language Q&A via Auto: Strategy's AI bot lets you ask data questions in plain language directly from the mobile app.
Strategy Integrations
Strategy offers 200+ native data connectors, including Snowflake, HubSpot, Marketo, Eloqua, ServiceNow, Shopify, and PayPal. It also supports Google Sheets, Microsoft 365, REST API, SQL, MDX, and DAX connectivity for custom data access.
Pros and Cons
Pros:
- Mobile barcode and QR code scanning
- True offline dashboard interaction and caching
- Multi-cloud deployment across any provider
Cons:
- High platform licensing and setup cost
- Android mobile app reviews cite slow performance
Learn more about Strategy: Best for associative engine analytics on mobile
- 30-day free trial
- Pricing upon request
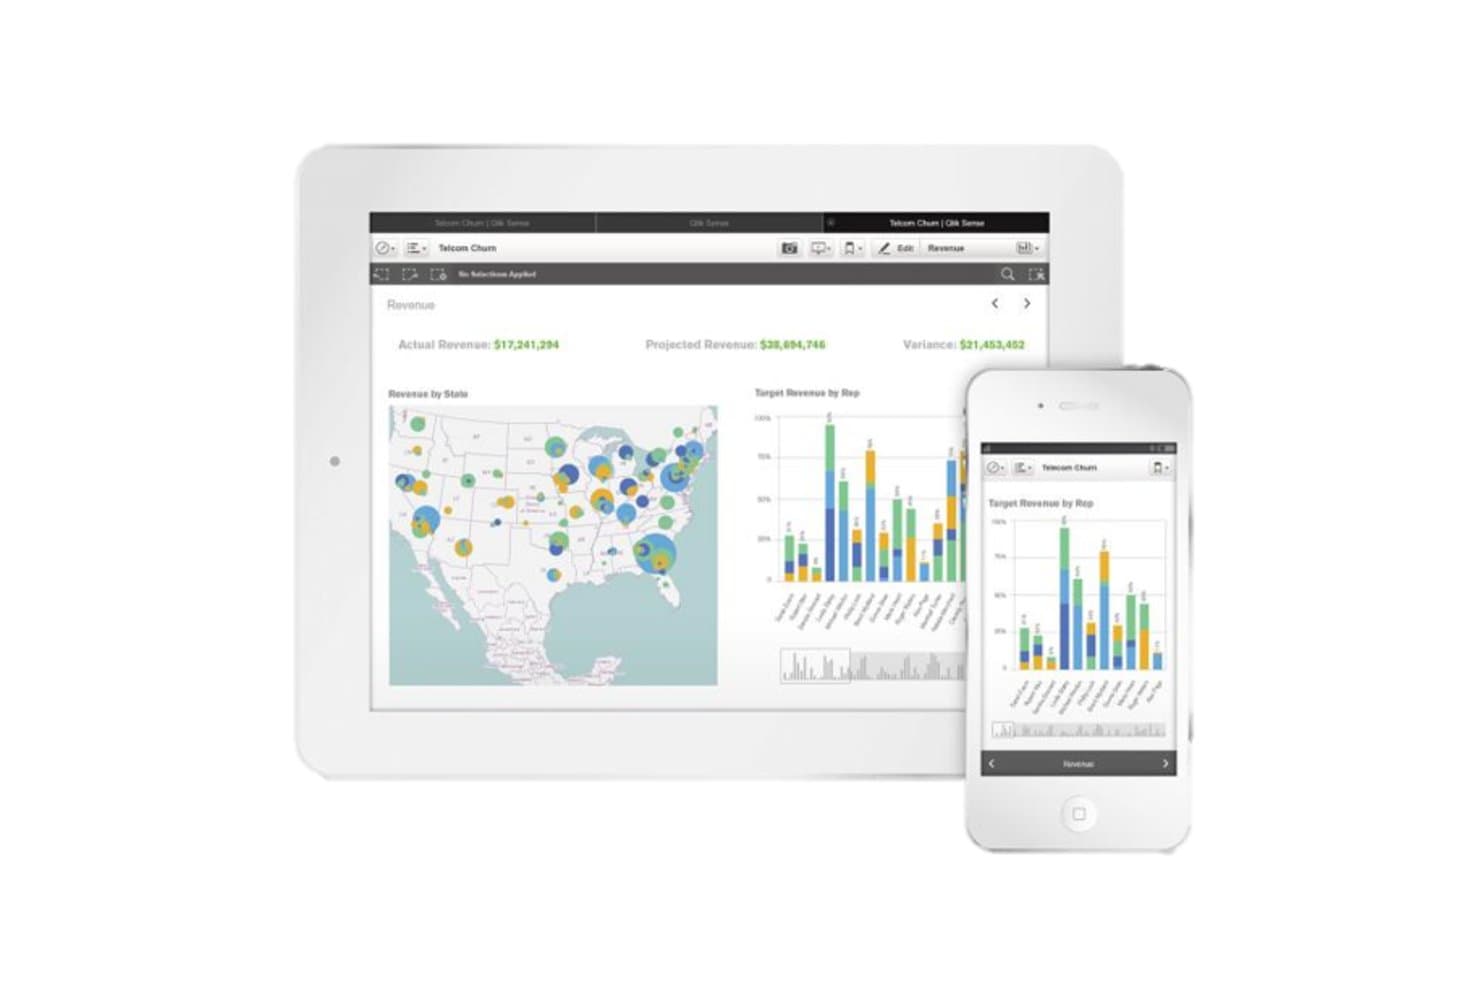
Qlik Sense delivers revenue dashboards across tablet and mobile devices. Qlik Sense is a cloud and on-premise BI platform that delivers interactive, associative analytics on mobile through native iOS and Android apps, with offline data exploration, push alerts, and enterprise-grade security controls.
Who Is Qlik Sense Best For?
Qlik Sense is a strong fit for enterprise BI and analytics teams that need interactive, associative data exploration on mobile across large, complex datasets from multiple sources.
Why I Picked Qlik Sense
I picked Qlik Sense as one of the best because its associative engine doesn't just display data on mobile—it runs full selections and drill-downs against downloaded app data, even offline. That means I can tap a region in a pipeline chart and watch every connected KPI update instantly, without a server connection. The dedicated Alerts tab with encrypted push notifications adds another layer I find genuinely useful, surfacing anomaly-triggered alerts directly in the app rather than burying them in email.
Qlik Sense Key Features
- Associative selection propagation: Tap any data point in a chart and every connected visualization updates instantly to reflect that selection across your entire dataset.
- Microsoft Intune SDK integration: The Qlik Analytics app has the Intune SDK built in, letting IT enforce MDM and MAM policies directly on the mobile app.
- Bookmarks on mobile: Create, edit, and delete saved selection states directly on your device, then share them with other users.
- No-code automation builder: Build triggered workflows that push updates to tools like Salesforce or Slack when specific data conditions are met.
Qlik Sense Integrations
Qlik Sense offers native connectors for Salesforce, Microsoft Dynamics CRM, Snowflake, BigQuery, Databricks, SAP, SharePoint, Google Sheets, SQL Server, and REST. Its Direct Access gateway and APIs support secure connections to on-premises and custom data sources.
Pros and Cons
Pros:
- Strong security controls for enterprise mobile use
- Integrated alerts and data-driven push notifications
- Native offline exploration with associative engine
Cons:
- Alerts and automations gated by subscription tier
- No authoring or editing on mobile
Learn more about Qlik Sense: Best for Microsoft-stack mobile data collaboration
- Free plan available
- From $14/user/month (billed annually)
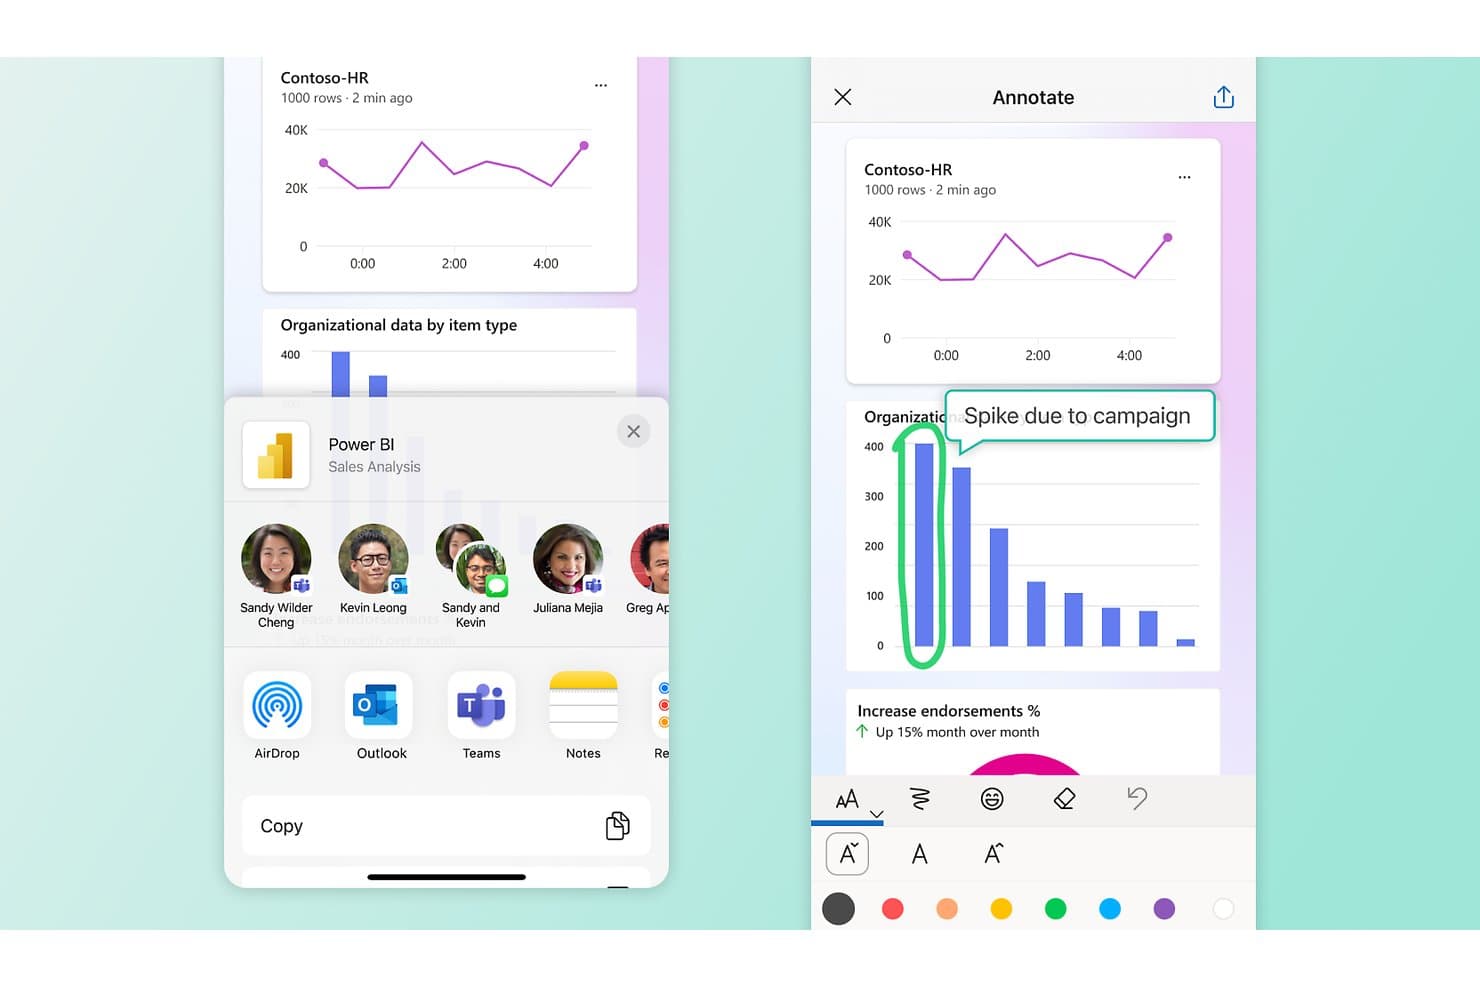
Microsoft Power BI lets users annotate and share reports on mobile. Microsoft Power BI is a business intelligence platform with native iOS and Android apps that delivers interactive dashboards, AI-powered Copilot chat, GPS-based geo filtering, and barcode/QR/NFC data capture for field and distributed teams.
Who Is Microsoft Power BI Best For?
Power BI is a strong fit for enterprises already invested in the Microsoft ecosystem—Azure, Microsoft 365, or Dynamics 365—that need governed, collaborative BI on mobile across distributed teams.
Why I Picked Microsoft Power BI
Microsoft Power BI earns its spot on my shortlist because no other mobile BI tool matches its depth of Microsoft-stack integration, from Azure and Dynamics 365 to Teams and Microsoft Fabric, making it the obvious choice for enterprises already in that ecosystem. I particularly like the GPS-based geo filtering, which lets field reps instantly filter live reports by their current location, and the NFC tag support (GA September 2025) that opens a specific report the moment a device taps a tagged asset. Copilot's full in-report chat experience on both phones and tablets rounds out what I'd consider a genuinely field-ready mobile BI setup.
Microsoft Power BI Key Features
- Copilot in-report chat: Ask questions about your data in natural language directly within a report on iOS or Android, with full conversational follow-ups and AI-generated summaries.
- Auto-create mobile layout: Generate a phone-optimized dashboard layout in a single click, removing the need to manually rebuild report views for smaller screens.
- Intune MAM/MDM integration: Enforce app protection policies, require an access PIN, and encrypt app data at rest on both managed and BYOD devices without enrolling the device.
- Semantic model governance layer: Define metrics, hierarchies, and row-level security once in a centralized model that all connected mobile reports and dashboards inherit automatically.
Microsoft Power BI Integrations
Power BI has native integrations across the Microsoft ecosystem, including Microsoft 365, Azure, Dynamics 365, Dataverse, Microsoft Fabric, and OneLake, plus connectors for Salesforce, Snowflake, Google BigQuery, and Amazon Redshift. REST APIs and custom Power Query connectors support custom integrations.
Pros and Cons
Pros:
- Strong governance with Intune MAM/MDM support
- Field-friendly GPS and barcode data capture
- Copilot AI chat built into reports
Cons:
- Offline mode excludes DirectQuery reports
- Data alerts limited to card visuals
Learn more about Microsoft Power BI: Best for AI-driven mobile KPI alerts and governance
- 14-day free trial + free demo available
- From $25/user/month (billed annually)
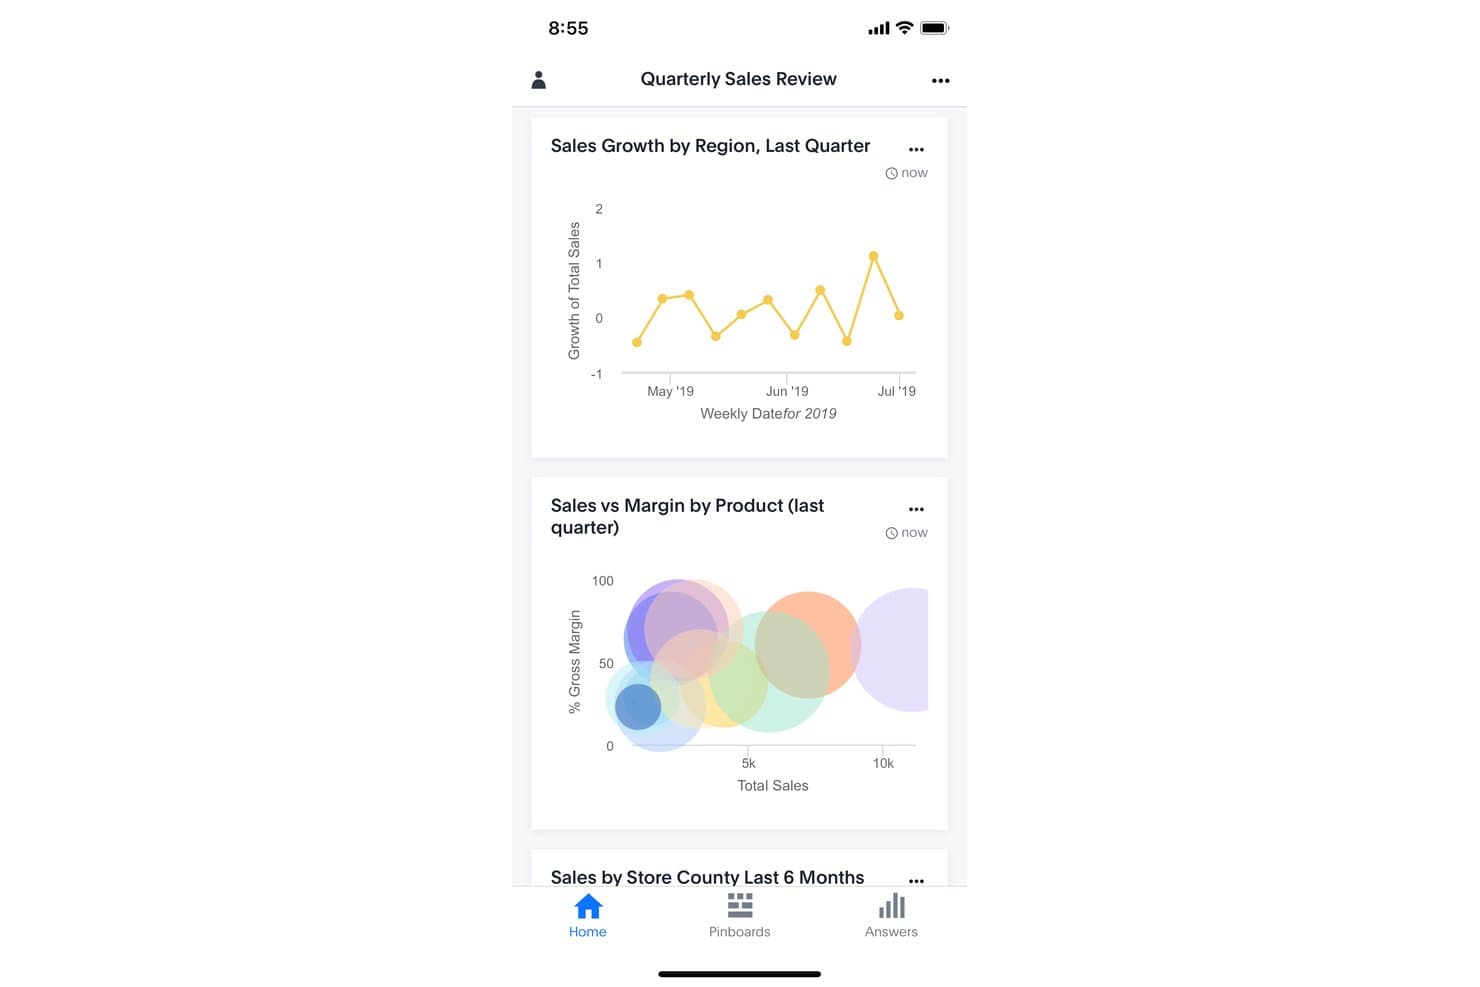
ThoughtSpot displays sales dashboards with charts on mobile. ThoughtSpot is a mobile BI platform that delivers AI-driven natural language querying, interactive Liveboards, automated KPI monitoring, and enterprise-grade governance across iOS and Android.
Who Is ThoughtSpot Best For?
ThoughtSpot is a strong fit for enterprise BI and analytics teams that need AI-driven KPI monitoring, deep governance, and natural language querying across iOS and Android.
Why I Picked ThoughtSpot
I picked ThoughtSpot as one of the best because its AI-driven KPI alerting goes well beyond basic push notifications. The Watchlist feature delivers anomaly detection with narrative explanations of why a metric shifted, so when pipeline coverage drops mid-quarter, you're not just alerted but told what drove the change. Paired with enterprise MDM support (Intune, Workspace ONE, MobileIron) and controls like remote wipe and screenshot blocking, it's built for teams where governance is non-negotiable.
ThoughtSpot Key Features
- Spotter 3 agentic AI search: Ask questions in natural language on iOS or Android and get AI-generated answers, narrative summaries, and recommended next steps from your live data.
- Liveboard drill-downs: Tap into any mobile-optimized chart to explore underlying data with dynamic drill-downs that follow no pre-defined path.
- One-tap sharing to Slack and Teams: Send any chart or insight directly to Slack, Microsoft Teams, or email without requiring recipients to log into ThoughtSpot.
- Row-level security enforcement: Access controls and RLS policies set on the desktop apply automatically to every mobile session, so users only see data they're permitted to view.
ThoughtSpot Integrations
ThoughtSpot offers 25+ documented native data connections, including Salesforce, Snowflake, Databricks, Amazon Redshift, and Google BigQuery, plus Slack and Microsoft Teams sharing. REST APIs and the Visual Embed SDK support custom integrations.
Pros and Cons
Pros:
- Drill-anywhere dashboards with live query access
- Enterprise-grade mobile data governance controls
- AI search with narrative KPI explanations
Cons:
- No mobile-native commenting or annotation
- Limited offline interactivity for dashboards
Learn more about ThoughtSpot:
Other Mobile BI Software
Even though my list of BI tools is already exhaustive, I couldn’t resist adding a few more options to really ensure a comprehensive roundup:
- 11YellowfinBest for AI-driven anomaly alerts on mobile
- 12Salesforce CRM AnalyticsBest for CRM-native revenue analytics on mobile
- 13LookerBest for governed multi-warehouse analytics on mobile
- 14Zoho AnalyticsBest for voice query and on-device dashboard editing
- 15SAS Visual AnalyticsBest for enterprise-scale multi-platform mobile BI
- 16Dimensional InsightBest for pre-built industry app analytics on mobile
- 17InetSoft Style IntelligenceBest for blending multi-source data into mobile views
Related Mobile BI Software Reviews
If you still haven't found what you're looking for here, check out these tools closely related to mobile BI software that we've tested and evaluated.
- Sales Software
- Lead Management Software
- Business Intelligence Software
- Contract Management Software
- Revenue Management System
- CPQ Software
How I Evaluate Mobile BI Software
I split my evaluation into baseline requirements—like native mobile apps and real-time pipeline dashboards—and differentiators that separate good tools from great ones for revenue teams in the field.
Core Functionality (Table Stakes For This List)
When I'm selecting tools for my list, I rank each one on a scale from 0 (does not offer the functionality) to 5 (excels in this area) for each core functionality listed below. Then, I calculate the tool's total score into a percentage. Each tool needs to achieve a minimum total score of 65% to be considered for inclusion.
- Native Mobile Apps: I check whether a vendor offers dedicated iOS and Android apps rather than just a responsive browser experience, including whether layouts are optimized for both phone and tablet screens.
- Interactive Mobile Dashboards: Tapping a pipeline stage to drill into deal-level detail is the kind of touch-native interactivity I evaluate, along with cross-filtering and gesture-based navigation.
- Real-Time Data Sync: I look at how quickly mobile dashboards reflect changes in the source system, such as a rep updating an opportunity stage in Salesforce and seeing that reflected on mobile within minutes.
- Push Notifications & Alerts: Configurable threshold alerts matter here. I evaluate whether you can set a push notification for something like a forecast drop exceeding a set percentage or a deal slipping stages.
- Offline Access: Field reps often walk into buildings with poor connectivity. I look for cached dashboard access that lets users review account metrics and saved reports without a live connection.
- Mobile Security & SSO: Enterprise teams need more than a password. I evaluate support for SSO, MFA, biometric unlock, and MDM compatibility with platforms like Intune or Workspace ONE.
Once I have a list of tools that meet the criteria, I consider what sets each platform apart.
Differentiating Factors (What Sets Vendors Apart)
Here's how I compare and contrast different vendors:
Standout Features
Natural language query is a feature I value highly. It lets a sales leader ask "what's my team's win rate this quarter?" from their phone and get an instant visualization. AI-driven insights build on this by flagging anomalies like a sudden pipeline contraction before anyone manually spots it. I also evaluate CRM integration depth, specifically whether a tool pulls Salesforce or HubSpot opportunity data into mobile dashboards with full deal-level context intact.
Beyond Features
Licensing structure matters a lot here. Some vendors gate mobile access behind premium tiers, which can blow up costs when you need dozens of field reps viewing dashboards. I also evaluate how well a platform performs on cellular networks since a dashboard that takes 30 seconds to load between client meetings won't get used. Integration breadth beyond CRM is important too. RevOps teams typically pipe data through Snowflake or BigQuery, so I check whether the mobile app reflects warehouse-connected reports with the same fidelity as the desktop experience.
How To Choose Mobile BI Software
With so many different mobile BI software available, it can be challenging to make decisions on what tool is going to be the best fit for your needs.
As you're shortlisting, trialing, and selecting mobile BI software, consider the following:
- What problem are you trying to solve - Start by identifying the mobile BI software feature gap you're trying to fill to clarify the features and functionality the tool needs to provide.
- Who will need to use it - To evaluate cost and requirements, consider who'll be using the software and how many licenses you'll need. You'll need to evaluate if it'll just be the revenue operation leaders or the whole organization that will require access. When that's clear, it's worth considering if you're prioritizing ease of use for all or speed for your mobile BI software power users.
- What other tools it needs to work with - Clarify what tools you're replacing, what tools are staying, and the tools you'll need to integrate with, such as accounting, CRM, or HR software. You'll need to decide if the tools will need to integrate together or if you can replace multiple tools with one consolidated mobile BI software.
- What outcomes are important - Consider the result that the software needs to deliver to be considered a success. Consider what capability you want to gain or what you want to improve, and how you will be measuring success. For example, an outcome could be the ability to get greater visibility into performance. You could compare mobile BI software features until you’re blue in the face but if you aren’t thinking about the outcomes you want to drive, you could be wasting a lot of valuable time.
- How it would work within your organization - Consider the software selection alongside your workflows and delivery methodology. Evaluate what's working well and the areas that are causing issues that need to be addressed. Remember every business is different — don’t assume that because a tool is popular that it'll work in your organization.
Trends In Mobile BI Software For 2026
Through a detailed review of the latest product updates, press releases, and release logs from the leading mobile BI tools, several key trends have emerged. These trends not only reflect the evolving needs of businesses in leveraging data but also highlight the shift towards more dynamic, intuitive, and predictive analytics capabilities.
Enhanced Real-time Data Analytics:
- Real-time data processing and analytics have become more sophisticated, enabling businesses to make faster, more informed decisions directly from their mobile devices. This evolution addresses the need for immediate insights into sales, customer behavior, and market trends.
Increased Use of AI and Machine Learning:
- AI and machine learning features are rapidly evolving within mobile BI software, offering predictive analytics, automated data cleansing, and intelligent recommendations. These advancements are crucial for businesses looking to anticipate market shifts and optimize revenue operations proactively.
Most Important and In Demand Features
Seamless Cross-Platform Accessibility:
- The ability to access and interact with BI tools across various devices without loss of functionality or data integrity is highly valued. This feature ensures that decision-makers can stay informed, regardless of their physical location or the device they're using.
Customizable Reporting and Dashboards:
- Customizable reporting features and dashboards allow users to tailor their analytics experience, focusing on the metrics that matter most to their specific role or business goals. This customization is key for efficiently monitoring and managing revenue operations.
Novel and Unusual Functionality
Augmented Reality (AR) for Data Visualization:
- Some mobile BI tools are incorporating AR to offer immersive data visualization experiences, allowing users to interact with data in three-dimensional space. This innovative approach can transform complex data sets into more understandable and actionable insights.
Features Becoming Less Important
Static Reporting:
- As dynamic and interactive reporting capabilities become more sophisticated, the demand for static, one-size-fits-all reports is diminishing. Businesses now require flexible reporting that can adapt to changing data and business needs.
The trends in mobile BI software highlight a shift towards tools that not only provide deeper insights and predictive analytics but also emphasize user accessibility, real-time data analysis, and innovative visualization techniques. For revenue operation leaders, selecting a mobile BI tool that aligns with these trends will be essential for navigating the complexities of today's business landscape and driving sustainable growth.
What Is Mobile BI Software?
Mobile Business Intelligence (BI) software is a type of application that allows users to access and analyze business data through their mobile devices. It extends the functionality of traditional BI systems, offering tools for data visualization, reporting, and analysis optimized for smartphones and tablets. This software enables real-time access to key business metrics and interactive dashboards, facilitating on-the-go data analysis and decision-making.
The benefits of mobile BI software include enhanced accessibility and convenience, allowing business professionals to stay informed and make data-driven decisions from anywhere. It supports timely decision-making with real-time data access and improves collaboration by enabling team members to share insights remotely. Mobile BI software increases overall productivity by providing immediate access to business intelligence, enabling quick responses to market changes and business challenges. It is particularly valuable for professionals who require constant access to data and insights in a fast-paced business environment.
Features Of Mobile BI Software
Mobile Business Intelligence (BI) software has become indispensable for managing revenue operations effectively. These tools empower decision-makers with real-time insights, predictive analytics, and comprehensive data visualizations, all accessible from the convenience of a mobile device. As we delve into the essential features of mobile BI software, it's clear that certain functionalities stand out for their ability to enhance decision-making, improve operational efficiency, and ultimately drive revenue growth. Here are the most important features to consider:
- Real-Time Data Access: Enables immediate access to up-to-date business data. This feature is crucial for making informed decisions on the fly, allowing businesses to respond swiftly to market changes and operational challenges.
- Interactive Dashboards: Provide a customizable and interactive interface for data analysis. Interactive dashboards allow users to drill down into the specifics of their data, making it easier to uncover actionable insights and monitor key performance indicators (KPIs) critical to revenue operations.
- Predictive Analytics: Utilizes historical data to forecast future trends. Predictive analytics can identify potential revenue opportunities and risks, guiding strategic planning and decision-making processes.
- Cross-Platform Compatibility: Ensures seamless functionality across various devices and operating systems. This feature ensures that stakeholders can access vital business intelligence regardless of their chosen device, maintaining productivity and informed decision-making on the go.
- Collaboration Tools: Facilitate sharing insights and reports among team members. Collaboration tools are essential for aligning strategies across departments, fostering a unified approach to managing revenue operations.
- Data Integration Capabilities: Supports integrating data from multiple sources, including CRM, ERP, and social media. A comprehensive view of data from various sources is vital for understanding all aspects of revenue operations and making informed decisions.
- Customizable Reporting: Allows users to create reports tailored to their specific needs. Customizable reporting enables businesses to focus on the metrics that matter most to their revenue operations, ensuring that reports are both relevant and actionable.
- User Access Controls: Manage user permissions and access to sensitive data. This feature is important for maintaining data security and compliance, especially when handling sensitive financial information.
- Offline Access: Provides access to data and reports even without an internet connection. Offline access ensures that decision-makers can always access critical information, regardless of connectivity issues.
- Scalability: Adapts to the growing amount of data and users as the business expands. Scalability is crucial for ensuring that the BI software can continue to meet the needs of the business as it grows, without performance degradation.
Selecting the right mobile BI software involves looking for features that not only provide deep insights into revenue operations but also offer flexibility, scalability, and real-time capabilities. By focusing on tools that embody these functionalities, businesses can equip themselves with the intelligence needed to navigate the complexities of the market and steer their operations towards sustained growth.
Benefits Of Mobile BI Software
The ability to access and analyze data on the go has become a necessity for effective revenue operations management. Mobile Business Intelligence (BI) software meets this need by providing powerful analytics capabilities directly through mobile devices, ensuring that decision-makers have the information they need, whenever and wherever they need it. Here are five primary benefits of mobile BI software for users and organizations, highlighting why it is an invaluable tool for anyone looking to optimize their revenue operations.
- Real-Time Decision Making: Mobile BI software enables access to real-time data analytics and insights. This immediacy allows users to make informed decisions quickly, a crucial advantage in dynamic market conditions where delays can cost opportunities.
- Increased Productivity: With the ability to analyze data and generate reports directly from a mobile device, users can remain productive regardless of their location. This flexibility ensures that decision-making and strategic planning can continue uninterrupted, even when away from the office.
- Improved Collaboration: Many mobile BI solutions offer collaborative features that enable teams to share insights and reports easily. Enhanced collaboration leads to better-aligned strategies across departments, improving overall business efficiency and effectiveness.
- Customized Alerts and Notifications: Users can set up customized alerts for key performance indicators, ensuring they are immediately notified of significant changes. This feature helps businesses respond more swiftly to potential issues or opportunities, protecting and maximizing revenue.
- Accessible and User-Friendly: Mobile BI software is designed for accessibility, offering intuitive interfaces and visualization tools that make complex data easy to understand. This user-friendliness ensures that all team members, regardless of their technical expertise, can leverage BI insights to contribute to revenue operations.
Costs & Pricing For Mobile BI Software
Selecting the right mobile Business Intelligence (BI) software is a pivotal decision for organizations aiming to enhance their data analytics and reporting capabilities on the go. Mobile BI tools vary widely in their features, scalability, and pricing models, catering to businesses of all sizes and industries. Understanding the different plan options and their respective pricing is crucial for making an informed decision that aligns with your organization's needs and budget constraints. Below is a breakdown of common plan options for mobile BI software, designed to help potential buyers navigate their choices.
Plan Comparison Table For Mobile BI Software
| Plan Type | Average Price | Common Features Included |
|---|---|---|
| Plan TypeStarter | Average Price$10 - $50 per user/month | Common Features IncludedBasic analytics, standard reporting, access on multiple mobile devices, limited data sources integration |
| Plan TypeProfessional | Average Price$50 - $150 per user/month | Common Features IncludedAdvanced analytics, customized reporting, increased data sources integration, collaboration features |
| Plan TypeEnterprise | Average Price$150 - $500+ per user/month | Common Features IncludedFull suite of analytics and reporting features, unlimited data sources, dedicated support, enhanced security |
| Plan TypeFree | Average Price$0 | Common Features IncludedBasic analytics and reporting capabilities, limited access, community support only |
When choosing a mobile BI software plan, consider both the current and anticipated future analytics needs of your organization, as well as the level of support and security required. Balancing these factors against the available budget will guide you to the most suitable plan, ensuring that you invest in a solution that offers the best value and aligns with your business objectives.
Mobile BI Software Frequently Asked Questions
If you still have questions about mobile business intelligence software, keep reading to find my answers to the most frequently asked questions.
What are the types of mobile BI software?
Mobile Business Intelligence (BI) software has become an indispensable tool for organizations seeking to access, analyze, and leverage business data from anywhere, at any time. This type of software varies in capabilities, features, and use cases, catering to the diverse needs of businesses across sectors. Understanding the types of mobile BI software can help organizations choose the right solution to support their decision-making processes and strategic goals. Here are the primary types of mobile BI software:
- Dashboard and Visualization Tools: These mobile BI applications focus on delivering data through interactive dashboards and visual representations, such as graphs and charts. They are designed for users who need at-a-glance insights and the ability to drill down into data for more detailed analysis.
- Reporting Tools: This type of mobile BI software emphasizes generating and distributing standard and custom reports. Users can create, view, and share reports directly from their mobile devices, ensuring that stakeholders have timely access to critical information.
- Self-service BI Tools: Self-service mobile BI software empowers users with little to no technical expertise to create their own reports and analyses without relying on IT departments. These tools are characterized by their user-friendly interfaces and drag-and-drop functionalities.
- Predictive Analytics Tools: These applications extend beyond traditional BI to offer predictive insights based on historical data analysis. They use statistical models and machine learning algorithms to forecast future trends, helping businesses anticipate market changes and make proactive decisions.
- Collaborative BI Tools: Focused on enhancing communication and collaboration among teams, these mobile BI tools integrate features like shared dashboards, comment sections, and notification systems. They facilitate a more coordinated approach to data-driven decision-making.
- Real-time BI Tools: Offering the capability to analyze and report data in real-time, these tools are crucial for businesses that require immediate insights for quick decision-making. They are particularly useful in dynamic industries where conditions change rapidly.
- Operational BI Tools: These are designed to integrate with operational systems, such as CRM and ERP, to provide real-time analytics that support day-to-day business operations. Operational BI tools help in monitoring current performance and making immediate adjustments.
- Embedded BI Tools: Embedded mobile BI software is integrated directly into other business applications or platforms, providing analytics and reporting capabilities within the context of the application being used. This seamless integration enhances the utility and accessibility of BI features.
Selecting the right type of mobile BI software depends on various factors, including the specific business needs, the technical expertise of users, the volume and complexity of data, and the desired level of mobility. By carefully assessing these aspects, organizations can identify the most suitable mobile BI solution to support their strategic objectives and drive informed decision-making.
Who uses mobile BI software?
Mobile BI is useful across a number of industries and roles. You may find a university president tracking security on campus through remote viewing of real-time data on reported incidents and crowd size. Or, a hospital admin out of town can still make informed staffing decisions since they have access to room usage and availability data on their mobile app.
What else can you use business intelligence software for?
Business intelligence tools are designed to collect and sort data to provide your team with unique insights to improve your business strategies. They offer data visualization, performance management, reporting tools, text mining, and predictive analytics. These business intelligence solutions can also provide automation and machine learning tools for AI-driven data.
Additional Revenue Operations Software
Are you looking for other business analytics tools to round out your tech stack? Take a look at overviews for the top analytics software options here: