14 Best Power BI Courses To Take In 2026


Here are some of the best Power BI courses for revenue operation leaders to enroll in and learn about data visualization, business intelligence skills, dashboard creation, strategies, and philosophies about the way we work.
Best Power BI Courses Shortlist
Here's a shortlist of the best Power BI courses I think are worth your time:
- Microsoft Power BI Data Analyst Professional Certificate (Microsoft)
- Microsoft Power BI Certification Training (Intellipaat)
- Analyzing and Visualizing Data with Power BI (Davidson College)
- Design Effective Reports in Power BI (Microsoft Learn)
- Model Data with Power BI (Microsoft Learn)
- From Excel to Power BI (Knowledge Accelerators)
- Introduction to Power BI (Datacamp)
- Advanced Microsoft Power BI (Edureka)
- Data Storytelling with Power BI (Edureka)
- Power BI Data Methods (LinkedIn Learning)
- Data-Driven Decisions with Power BI (Knowledge Accelerators)
- Zero to Hero in Power BI: Data Visualization using Power BI (Udemy)
- Modeling Data in Power BI (Pluralsight)
- Identify Patterns and Trends in Power BI (Pluralsight)
Find more details about each course below.
Overview Of The Best Power BI Courses
1. Microsoft Power BI Data Analyst Professional Certificate (Microsoft)

This professional certificate helps learners master Microsoft Power BI by showing how to connect to data sources, transform and model data, design interactive dashboards, and maintain Power BI assets—all through hands‐on activities and a capstone project that aligns with the PL-300 exam.
You’ll build the core skills needed for modern data analysis and business intelligence roles using Power BI, working at your own pace while aiming for the Microsoft Certified: Power BI Data Analyst Associate certification.
- Who It’s For: Individuals pursuing careers in data analysis or business intelligence using Power BI
- Topics Covered:
- Preparing data for analysis with Excel
- Harnessing data power with Power BI
- Extracting, transforming, and loading data in Power BI
- Data modeling in Power BI
- Data analysis and visualization with Power BI
- Creative designing in Power BI
- Deploying and maintaining Power BI assets through a capstone project
- Online, In-Person, or Both? Online
- Exam Required? Yes
- Duration: 5 months
- Hours Of Instruction: 10 hours per week
- Eligibility Requirements: None
- Price: Coursera subscription required
- Monthly Subscription: $59 per month
- Annual Subscription: $399 per year
2. Microsoft Power BI Certification Training (Intellipaat)

This training guides professionals and business analysts through the fundamentals of Microsoft Power BI, including data transformation, product configuration, pricing–quote workflows, and real-world dashboard implementation. You’ll gain hands-on experience using live business data and structured training to build skills that support data-driven decision-making in your organization.
- Who It’s For: Professionals seeking in-depth Power BI knowledge
- Topics Covered:
- Data transformation and modeling
- Power BI desktop installation and configuration
- Data visualization techniques
- Report and dashboard creation
- Online, In-Person, or Both? Online
- Exam Required? No
- Duration: 4 days (Tuesday-Friday) or 2 days (Saturday-Sunday)
- Hours Of Instruction: 20 hours (some instructor-led, some self-paced)
- Eligibility Requirements: None
- Price: Approximately $200

3. Analyzing and Visualizing Data with Power BI (Davidson College)
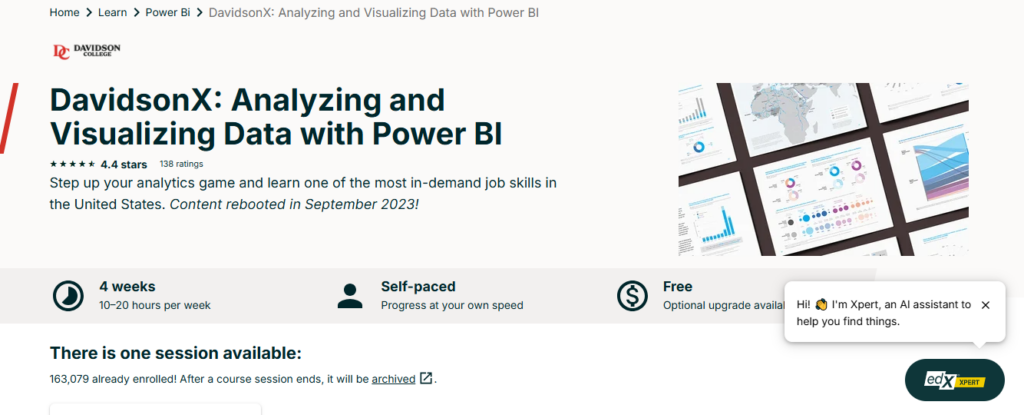
This course introduces beginner-level professionals and students to the art of turning business data into meaningful visualizations and dashboards using Power BI, with a focus on streamlining workflow and enhancing decision-making.
You’ll learn how to import and prepare data, build interactive reports, integrate with Power Automate, and share insights across your team. The structure and real-world orientation help you gain confidence and competence in using Power BI for analysis and visualization.
- Who It’s For: Beginner-level data professionals, students, researchers, and analysts in marketing, business, or finance seeking to improve their data visualization skills with Power BI
- Topics Covered:
- Data analysis
- Data visualization
- Power BI features and workflow
- Online, In-Person, or Both? Online
- Exam Required? No
- Duration: 4 weeks
- Hours Of Instruction: 10-20 hours per week
- Eligibility Requirements: None
- Price: $249 (or audit for free, no certificate)
4. Design Effective Reports in Power BI (Microsoft Learn)

This course teaches individuals how to elevate their Power BI report-building capabilities by focusing on visual choice, filter strategies, analytical features like Quick Insights, and creating paginated reports for high-precision output. You’ll learn to design reports that not only communicate effectively but also perform robustly for enterprise needs.
- Who It’s For: Individuals interested in creating and optimizing Power BI visuals and reports
- Topics Covered:
- Scoping report design requirements
- Designing Power BI reports
- Creating visual calculations
- Configuring report filters
- Enhancing report designs for user experience
- Performing analytics
- Creating paginated reports
- Online, In-Person, or Both? Online
- Exam Required? No
- Duration: Self-paced
- Hours Of Instruction: Approximately 5 hours
- Eligibility Requirements: Experience with Power BI Desktop
- Price: Free
5. Model Data with Power BI (Microsoft Learn)
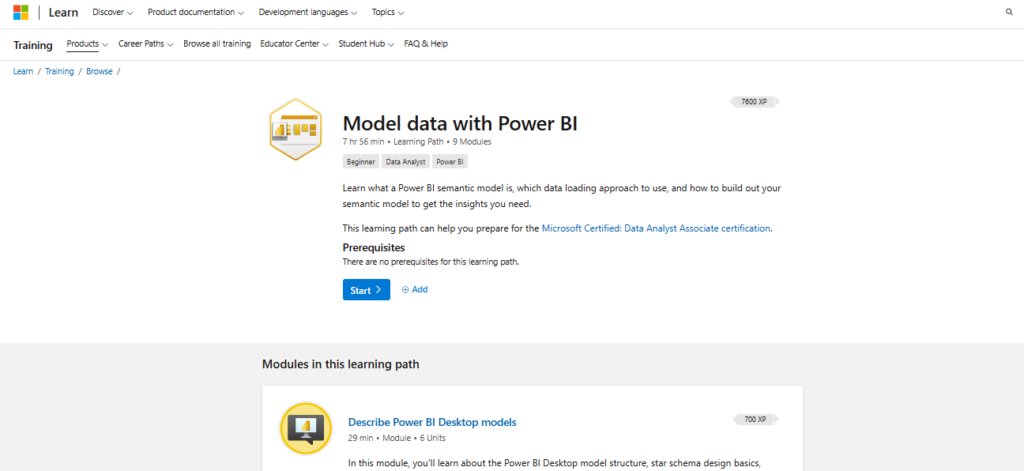
This course helps learners build strong semantic data models in Power BI by covering foundational modeling concepts like star schemas, DAX calculations, and optimization techniques.
You’ll learn how to structure data for performance, apply time-intelligence logic, and enforce security at both the row and object level. It’s designed to strengthen your end-to-end modeling skills for analytical and enterprise reporting needs.
- Who It’s For: Data professionals and analysts
- Topics Covered:
- Describing Power BI Desktop models
- Choosing a model framework
- Designing semantic models
- Writing DAX formulas
- Adding measures
- Adding calculated tables and columns
- Using DAX time-intelligence functions
- Optimizing model performance
- Enforcing model security
- Online, In-Person, or Both? Online
- Exam Required? No
- Duration: Self-paced
- Hours Of Instruction: Approximately 8 hours
- Eligibility Requirements: None
- Price: Free
6. From Excel to Power BI (Knowledge Accelerators)

This course helps Excel users transition confidently into Power BI by teaching how to import and transform data, model relationships, craft interactive visuals, and publish dashboards using Power BI Service. It’s designed for professionals who already use Excel and want a streamlined path into data visualization and reporting with Power BI.
- Who It’s For: Excel users looking to learn Power BI
- Topics Covered:
- Model data in Power BI
- Visualize data in Power BI
- Types of visualizations
- Power BI dashboards
- Online, In-Person, or Both? Online
- Exam Required? No
- Duration: Self-paced
- Hours Of Instruction: 3 hours
- Eligibility Requirements: Basic understanding of data analysis processes in Excel
- Price: Coursera subscription required
- Monthly Subscription: $59 per month
- Annual Subscription: $399 per year
7. Introduction to Power BI (Datacamp)
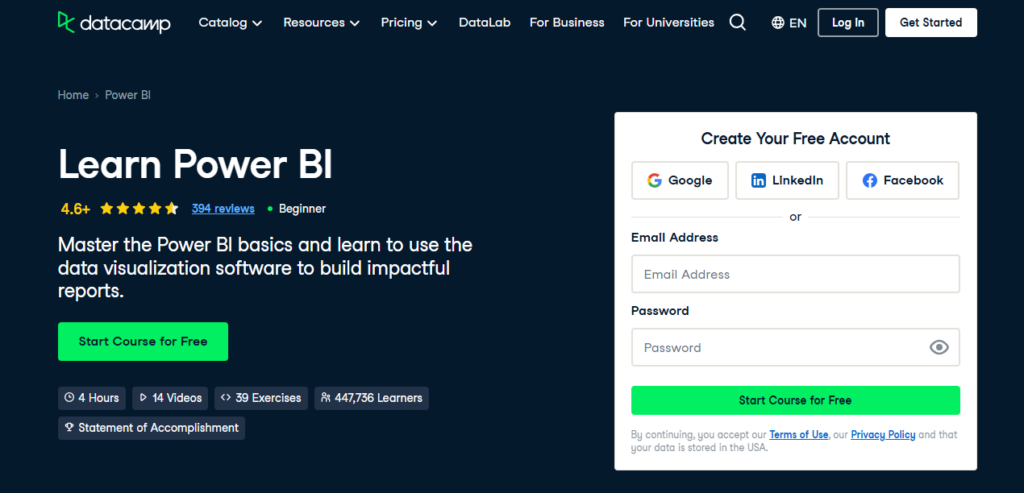
This course gives beginners a structured jump-start into Power BI by guiding you through data transformation, visualization, and interactive filtering within the platform’s core workspaces. You’ll learn how to navigate the Data, Model, and Report views, build visuals such as maps and hierarchies, and use Power Query Editor to shape your data for meaningful insights.
- Who It’s For: Beginners in data visualization
- Topics Covered:
- Getting started with Power BI
- Transforming data
- Visualizing data
- Filtering data
- Online, In-Person, or Both? Online
- Exam Required? No
- Duration: Self-paced
- Hours Of Instruction: 3 hours
- Eligibility Requirements: None
- Price: Free
8. Advanced Microsoft Power BI (Edureka)
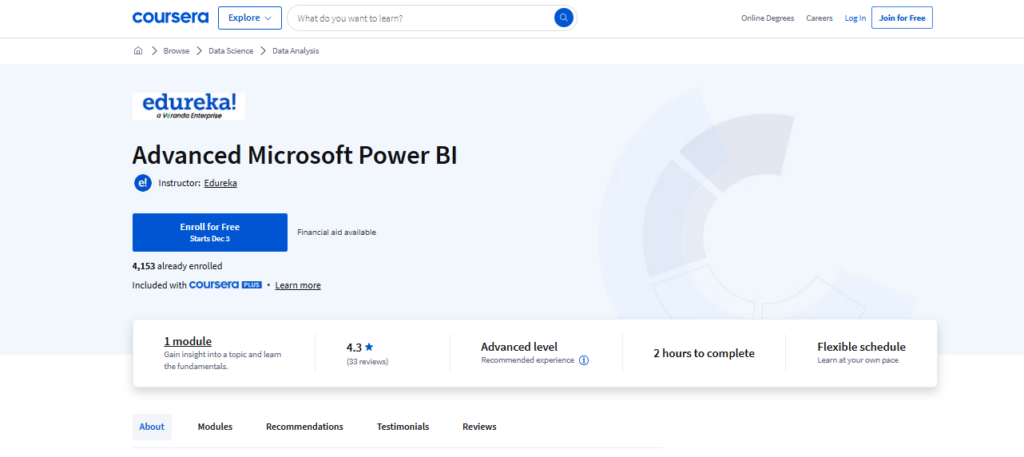
This advanced-level course builds on basic Power BI knowledge and shows you how to model complex datasets, apply machine learning and AI insights, and build dashboard scorecards meant for enterprise tracking and decision-making. It’s designed for professionals who already have Power BI experience and want to push into higher-impact analytics and reporting workflows.
- Who It’s For: Professionals with existing Power BI experience
- Topics Covered:
- Advanced Power BI features
- Data modeling for analytics
- Machine learning integrations
- Scorecards and binary prediction models
- Publishing and monitoring in Power BI Service
- Online, In-Person, or Both? Online
- Exam Required? No
- Duration: Self-paced
- Hours Of Instruction: 3 hours
- Eligibility Requirements: Prior experience in Power BI, RDBMS and machine learning
- Price: Coursera subscription required
- Monthly Subscription: $59 per month
- Annual Subscription: $399 per year
9. Data Storytelling with Power BI (Edureka)
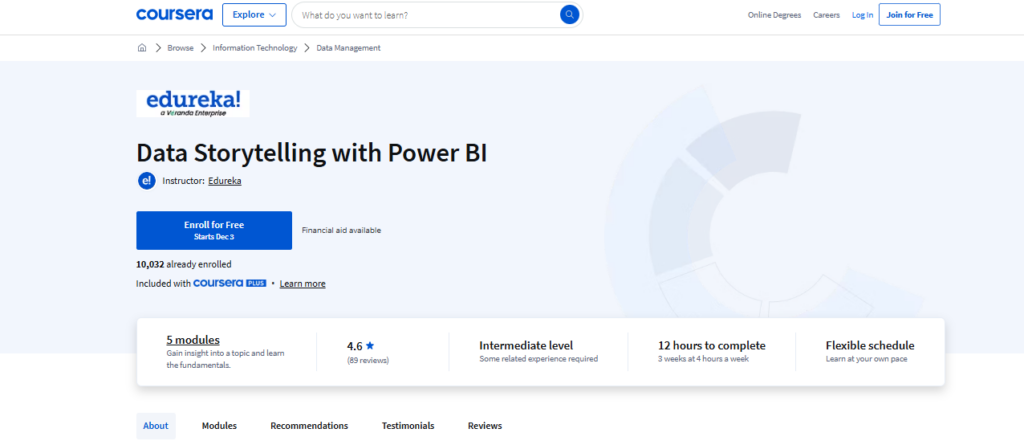
This course walks you through the essential steps of building impactful narratives using Power BI—starting with data preparation and transformation, then moving into DAX formulas, visualization design, and report publishing in Power BI Service. You’ll learn how to structure your dashboards like stories, secure them, and use advanced features like Smart Narrative to make your insights resonate.
- Who It’s For: Data professionals interested in storytelling
- Topics Covered:
- Data modeling and transformation
- Data analysis expressions (DAX)
- Data visualization and report design
- Using Power BI Service for sharing, securing and collaborating
- Online, In-Person, or Both? Online
- Exam Required? No
- Duration: 2 weeks
- Hours Of Instruction: 10 hours/week
- Eligibility Requirements: None
- Price: Coursera subscription required
- Monthly Subscription: $59 per month
- Annual Subscription: $399 per year
10. Power BI Data Methods (LinkedIn Learning)
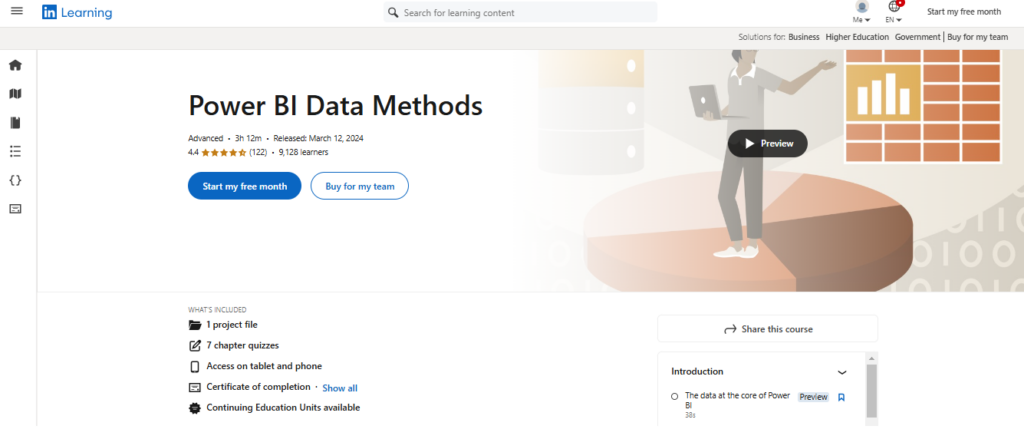
This course dives into using Power Query within Power BI to build ETL frameworks, handle relational data sources, and apply advanced cleaning and transformation techniques so your datasets are ready for meaningful analysis. You’ll learn how to navigate multiple data sources, apply custom M logic, and streamline your data loading process for better modeling and visualization.
- Who It’s For: Data professionals and analysts
- Topics Covered:
- Extracting data from files
- Transforming data with advanced cleaning operations
- Working with dates and times
- Using data functions
- Handling relational databases and queries
- Loading data into Power BI
- Online, In-Person, or Both? Online
- Exam Required? No
- Duration: Self-paced
- Hours Of Instruction: Approximately 3.5 hours
- Eligibility Requirements: None
- Price: LinkedIn Learning membership required
11. Data-Driven Decisions with Power BI (Knowledge Accelerators)
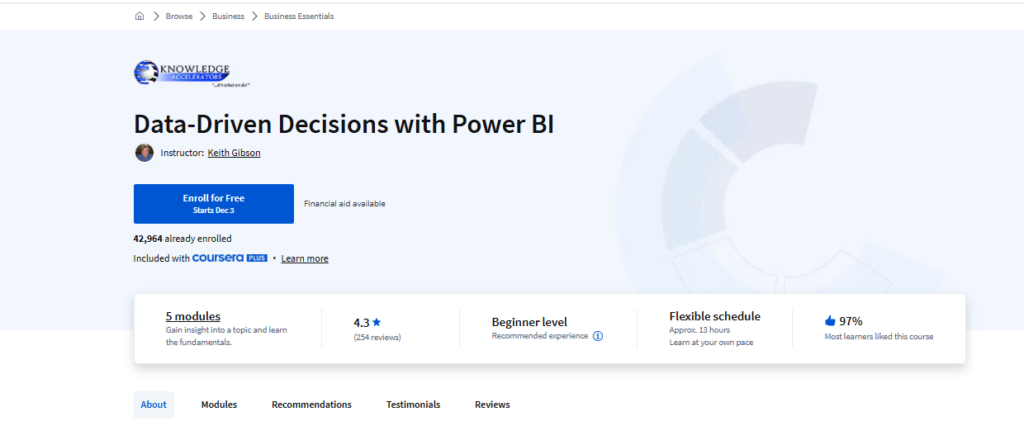
This course shows business professionals and analysts how to leverage Power BI for data-driven decision-making by turning raw information into interactive reports and dashboards that support strategic outcomes.
You’ll gain hands-on experience in modeling data, creating visualizations, and publishing insights to the Power BI Service so you can influence business strategies more effectively.
- Who It’s For: Business professionals and analysts
- Topics Covered:
- Understanding Power BI and data analysis
- Introduction to modeling data and visualizations
- Navigating reports and visualizations
- Navigating the Power BI Service
- Online, In-Person, or Both? Online
- Exam Required? No
- Duration: Self-paced
- Hours Of Instruction: 13 hours
- Eligibility Requirements: None
- Price: Coursera subscription required
- Monthly Subscription: $59 per month
- Annual Subscription: $399 per year
12. Zero to Hero in Power BI: Data Visualization using Power BI (Udemy)

This online course empowers professionals and analysts to import, transform and analyze data using Power BI, then build advanced data models and create interactive dashboards—including geographic visualizations—for stronger business insights.
You’ll work with Power Query, DAX formulas, and Power BI Desktop to design reports that drive decision-making and present data visually.
- Who It’s For: Business professionals, data analysts, IT professionals
- Topics Covered:
- Connecting Power BI to different data sources
- Preparing and manipulating data using Power Query
- Adding new columns using Power Query
- Creating a data model using relationships
- Creating charts and visuals in Power BI
- Advanced charts and geographic data visualizations
- Data analysis using DAX
- Creating beautiful and interactive reports in Power BI
- Online, In-Person, or Both? Online
- Exam Required? No
- Duration: Self-paced
- Hours Of Instruction: 7.5 hours
- Eligibility Requirements: None
- Price: Member Subscription Required
13. Modeling Data in Power BI (Pluralsight)

This course teaches how to turn raw data into insightful models in Power BI by blending multiple sources, prepping data for exploration, and using DAX for advanced calculation and context handling. You’ll gain the ability to enhance model structure, optimize relationships and hierarchies, and apply time-intelligence logic to drive richer reporting and analytics.
- Who It’s For: Data professionals and analysts
- Topics Covered:
- Loading data
- Exploring techniques in Power Query Editor
- Enhancing models with relationships and hierarchies
- Improving data models for reporting
- Using DAX to enhance models
- Working with dates and time
- Applying evaluation context
- Online, In-Person, or Both? Online
- Exam Required? No
- Duration: Self-paced
- Hours Of Instruction: Approximately 5 hours
- Eligibility Requirements: None
- Price: Membership required
- Standard: $19 per month
- Premium: $29 per month
14. Identify Patterns and Trends in Power BI (Pluralsight)

This course helps data professionals sharpen their ability to spot patterns, trends, and insights in Power BI by using a variety of visual techniques and AI-driven features. You’ll learn how to apply advanced visuals and intelligent tools to enhance speed, clarity, and impact of your data analysis.
- Who It’s For: Data analysts and professionals
- Topics Covered:
- Understanding visual analysis in Power BI
- Analyzing data with AI-powered visuals and tools
- Online, In-Person, or Both? Online
- Exam Required? No
- Duration: Self-paced
- Hours Of Instruction: Approximately 2 hours
- Eligibility Requirements: None
- Price: Membership required
- Standard: $19 per month
- Premium: $29 per month
Join For More Insights
Want to take your RevOps game to the next level? Subscribe to The CRO Club newsletter for expert advice, software reviews, and other resources to help you deliver predictable growth at scale.
