10 Best Self-Service BI Tools Reviewed For 2026

10 Best Self-Service BI Tools Shortlist


With so many different self-service BI tools available, figuring out which is right for you is tough. You know you want to make data analysis more accessible and user-friendly for your whole team but need to figure out which tool is best. I've got you! In this post I'll help make your choice easy, sharing my personal experiences using dozens of different self-service BI software with various teams and data sets, with my picks of the best self-service BI tools.
Why Trust Our Software Reviews
We’ve been testing and reviewing RevOps software since 2022. As RevOps leaders ourselves, we know how critical and difficult it is to make the right decision when selecting software.
We invest in deep research to help our audience make better software purchasing decisions. We’ve tested more than 2,000 tools for different RevOps use cases and written over 1,000 comprehensive software reviews. Learn how we stay transparent & our software review methodology.
Best Self-Service BI Tools Summary
This comparison chart summarizes pricing details for my top self-service BI tools selections to help you find the best one for your budget and business needs.
| Tool | Best For | Trial Info | Price | ||
|---|---|---|---|---|---|
| 1 | Best for spreadsheet-based live reporting | Free plan available | From $49/month (billed annually) | Website | |
| 2 | Best for extensive data integration | 15-day free trial + free plan + free demo available | From $24/month (billed annually) | Website | |
| 3 | Best for automated, self-explaining dashboards | Free plan available | From $29/month | Website | |
| 4 | Best for upskilling employees in BI development | Free trial available | From $250/user/month (billed annually) | Website | |
| 5 | Best for delivering trusted data experiences from the cloud of your choice | Free plan available | From $9/user/project/month | Website | |
| 6 | Best for accessing insights in real time | 30-day free trial + free demo available | Pricing upon request | Website | |
| 7 | Best for accessing auto SQL generation | 14-day free trial + free demo available | From $13/user/month | Website | |
| 8 | Best for web-based data modeling | 30-day free trial available | From $10/user/month | Website | |
| 9 | Best for acting on data at the point of insight | Free trial available | From $75/user/month | Website | |
| 10 | Best for versatile implementation on-premise or in the cloud | 30-day free trial available | From $162.30/month for up to 10 users | Website |
-

Prisync
Visit WebsiteThis is an aggregated rating for this tool including ratings from Crozdesk users and ratings from other sites.4.7 -
Expedite Commerce
Visit Website -
QuickBooks Online
Visit WebsiteThis is an aggregated rating for this tool including ratings from Crozdesk users and ratings from other sites.4


Best Self-Service BI Tool Reviews
Below are my detailed summaries of the best self-service BI tools that made it onto my shortlist. My reviews offer a detailed look at the key features, pros & cons, integrations, and ideal use cases of each tool to help you find the best one for you.
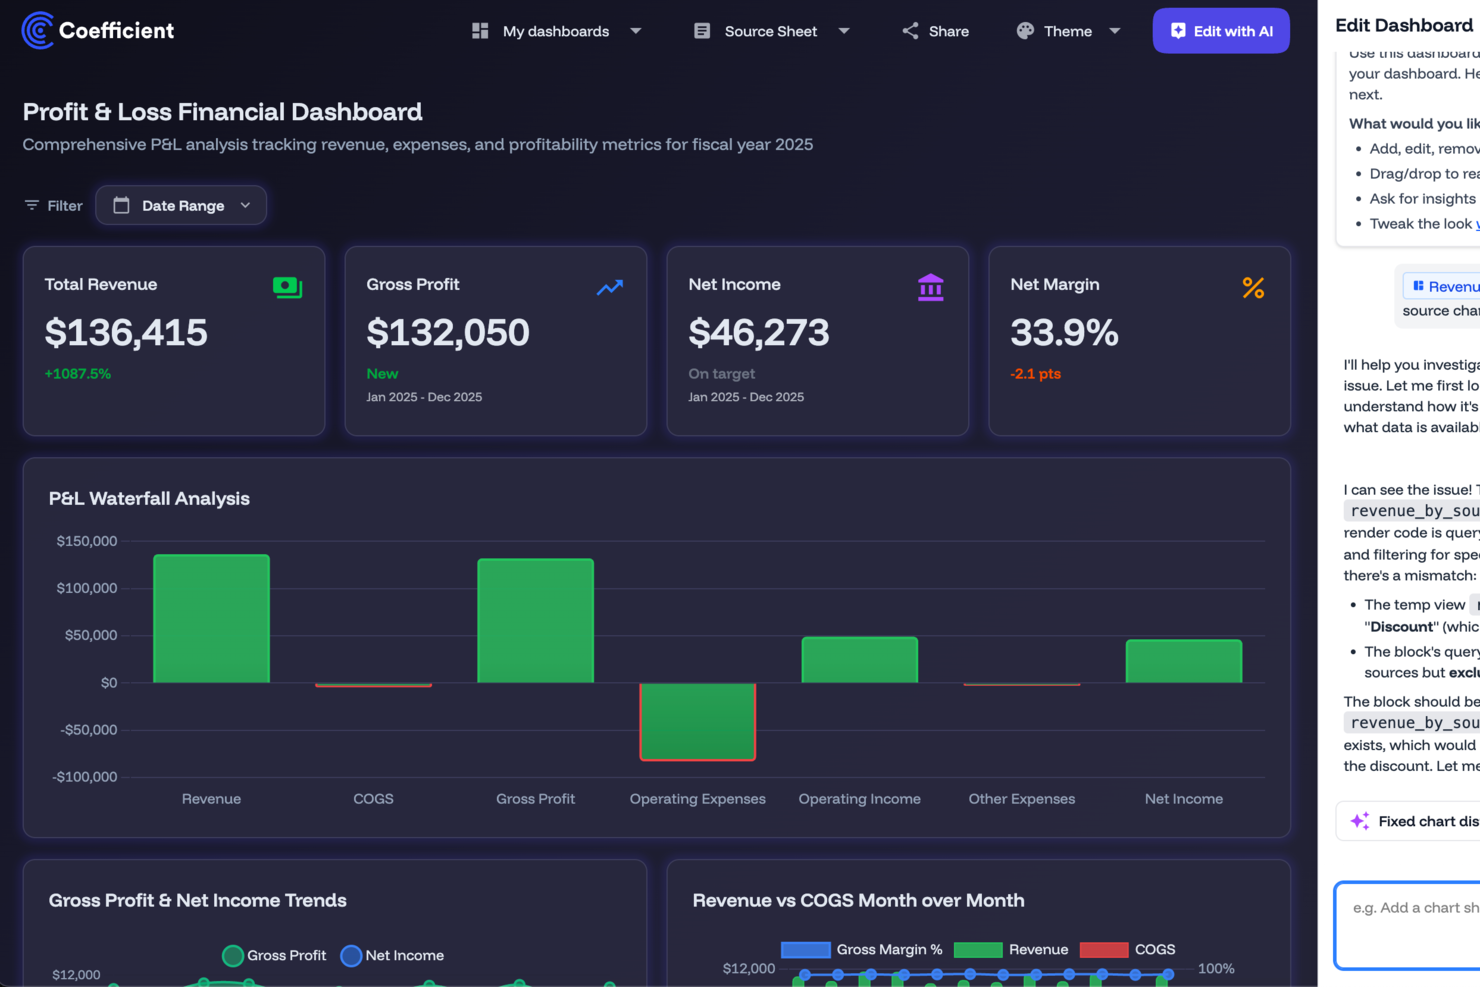
For teams seeking to elevate their data management and reporting capabilities, Coefficient offers a unique self-service BI solution. This tool appeals to finance, marketing, and analytics professionals who value AI-powered insights and streamlined workflows. Coefficient addresses the need for real-time data analysis and decision-making without the need for complex coding, making it an ideal choice for businesses looking to enhance operational efficiency.
Why I Picked Coefficient
I chose Coefficient because it’s an efficient way to achieve self-service BI without forcing users to learn a heavy, specialized analytics platform. It specifically solves the stale data problem by maintaining a live link between your spreadsheet and your data sources. Its AI modeling feature allows you to perform complex forecasting directly within spreadsheets, catering to the analytical needs of your team. These features make Coefficient a compelling choice for anyone looking to leverage self-service BI tools for enhanced data-driven strategies.
Coefficient Key Features
In addition to its AI capabilities, Coefficient includes several features that enhance its value as a self-service BI tool:
- Live dashboard creation: Build interactive web dashboards with real-time data visualizations.
- Scheduled auto-refresh: Automatically update reports and dashboards on a schedule that fits your team’s needs, eliminating manual exports.
- Automated alerts: Receive Slack or email notifications when key metrics change, enabling faster response times.
- Custom connectors: Create custom connectors to link spreadsheets with various systems for flexible data integration.
Coefficient Integrations
Integrations include Salesforce, QuickBooks, Snowflake, HubSpot, MySQL, Google Analytics, Shopify, Stripe, Redshift, and more.
Pros and Cons
Pros:
- Enables self-service BI directly within familiar spreadsheet environments
- Supports real-time data monitoring with automated alerts and refreshes
- Flexible integrations through native connectors and custom API options
Cons:
- Less suitable for teams seeking a traditional BI platform
- Primarily designed for spreadsheet-based analysis workflows
Zoho Analytics is a self-service business intelligence (BI) and data analytics software. It allows users to analyze their data, create data visualizations, and discover hidden insights quickly. The platform allows users to create dashboards and analyze data, facilitating smarter decision-making.
Why I picked Zoho Analytics: It offers extensive data integration, supporting a wide range of data sources, including files, databases, and various Zoho applications, making it a versatile tool for data analysis. It also includes a drag-and-drop interface, which simplifies the process of creating reports and dashboards. This feature is particularly beneficial for users with limited technical expertise.
Zoho Analytics Standout Features and Integrations
Standout features include various visual views like charts, pivot tables, and summary views, advanced analytics like trend analysis, forecasting, and regression, and an AI-powered assistant, Zia that offers natural language query capabilities for users to ask questions and receive insights without manual data manipulation.
Integrations include Zoho CRM, Microsoft Dynamics CRM, Salesforce CRM, HubSpot CRM, Google Ads, Google Analytics 4 (GA4), Jotform, Infraspeak, Repsly, VanillaSoft, ClickUp, WordPress, Podio, and Google Forms.
Pros and Cons
Pros:
- Live, customizable dashboards
- Excellent visual representation of data
- Can integrate with many data sources, including on-premise systems
Cons:
- Mobile app sometimes has delayed notifications
- Potential learning curve when customizing dashboards

Signara is an automated BI reporting tool that generates dashboards and plain-language narrative summaries directly from your connected data sources, with no SQL, DAX, or manual configuration required.
Who Is Signara Best For?
Signara is a good fit for marketing and finance teams at small to mid-sized businesses that need automated reporting without dedicated BI engineers or data analysts on staff.
Why I Picked Signara
I've included Signara in my top picks because of how fast you can go from raw data to a finished dashboard. The schema mapping and KPI detection happen automatically once you connect a data source, so there's no configuration layer to work through before you see results. I particularly like the drag-and-drop upload for Excel and CSV files, which means teams without any data infrastructure can still get output in minutes. There's no SQL, no DAX, and no report-building required.
Signara Key Features
- AI-generated narrative summaries: Signara automatically writes plain-language explanations of your KPI movements alongside each dashboard.
- Deterministic KPI engine: All calculations are code-based and auditable, so your reported numbers are consistent and traceable.
- Native data connectors: Connect directly to sources like HubSpot, Snowflake, BigQuery, GA4, and PostgreSQL without any middleware.
- PPTX export: Export finished reports as PowerPoint files ready for stakeholder presentations.
Signara Integrations
Signara offers native integrations with HubSpot, Google Analytics (GA4), Google Sheets, Snowflake, Databricks, BigQuery, PostgreSQL, and MySQL, and also supports drag-and-drop uploads for Excel and CSV files.
Pros and Cons
Pros:
- Reports generated from raw data instantly
- QR code sharing skips login barriers
- AI narratives explain what changed automatically
Cons:
- No custom SQL query editor available
- Lacks complex physical report exporting
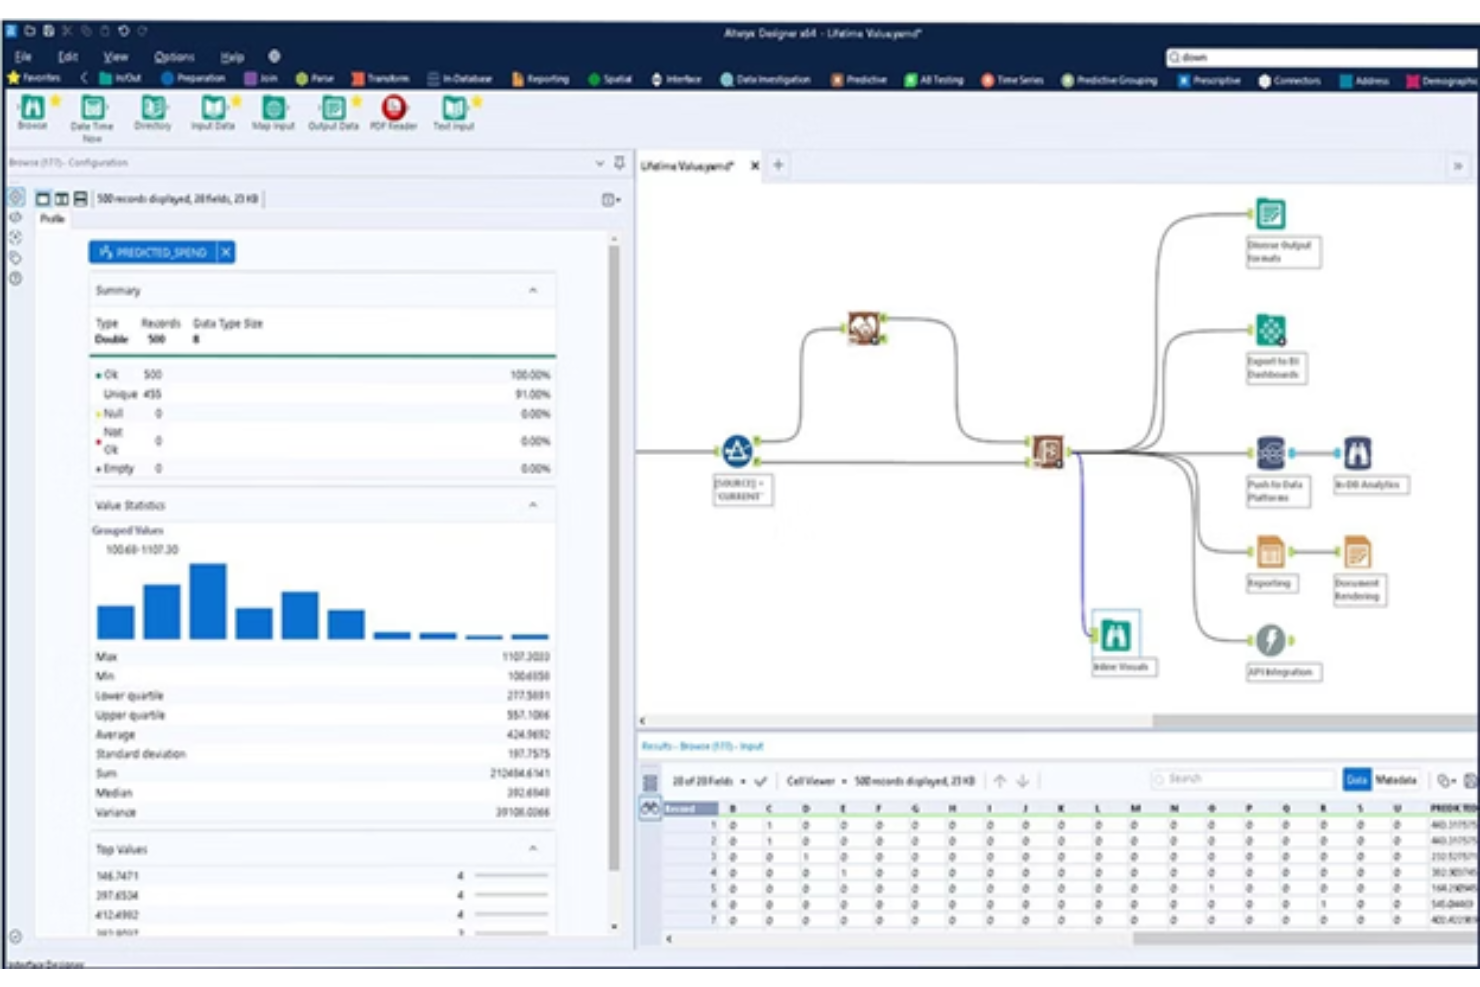
This cloud-based BI tool offers you the chance to automate every part of your analytics, from data prep to data science. Alteryx provides access to any data type or source, allowing you to blend all information through an intuitive drag-and-drop interface. This platform provides both no-code and low-code processes.
Why I picked Alteryx: What I really like about this platform is the focus on accelerating the time to value of BI tools by helping your team learn as much as possible about the program in the shortest amount of time. Whether it’s through built-in best practices, a learning program, or solutions shared by the Alteryx community, you have the tools to optimize implementation.
Alteryx Standout Features and Integrations
Standout features include automated machine learning with no coding required for non-technical users and data storytelling that explains insights in simple, clear language.
Integrations include Adobe Analytics, CARTO, DataRobot, Immuta, Microsoft Azure, Oracle, Syniti Matching, Tableau, UiPath, and Veritone Automate Studio.
Pros and Cons
Pros:
- Academy and learning tools for new users
- Comprehensive feature list
- The interface is very easy to use
Cons:
- Platform is pretty high priced
- Can be slow with a bad internet connection
Looker
Best for delivering trusted data experiences from the cloud of your choice
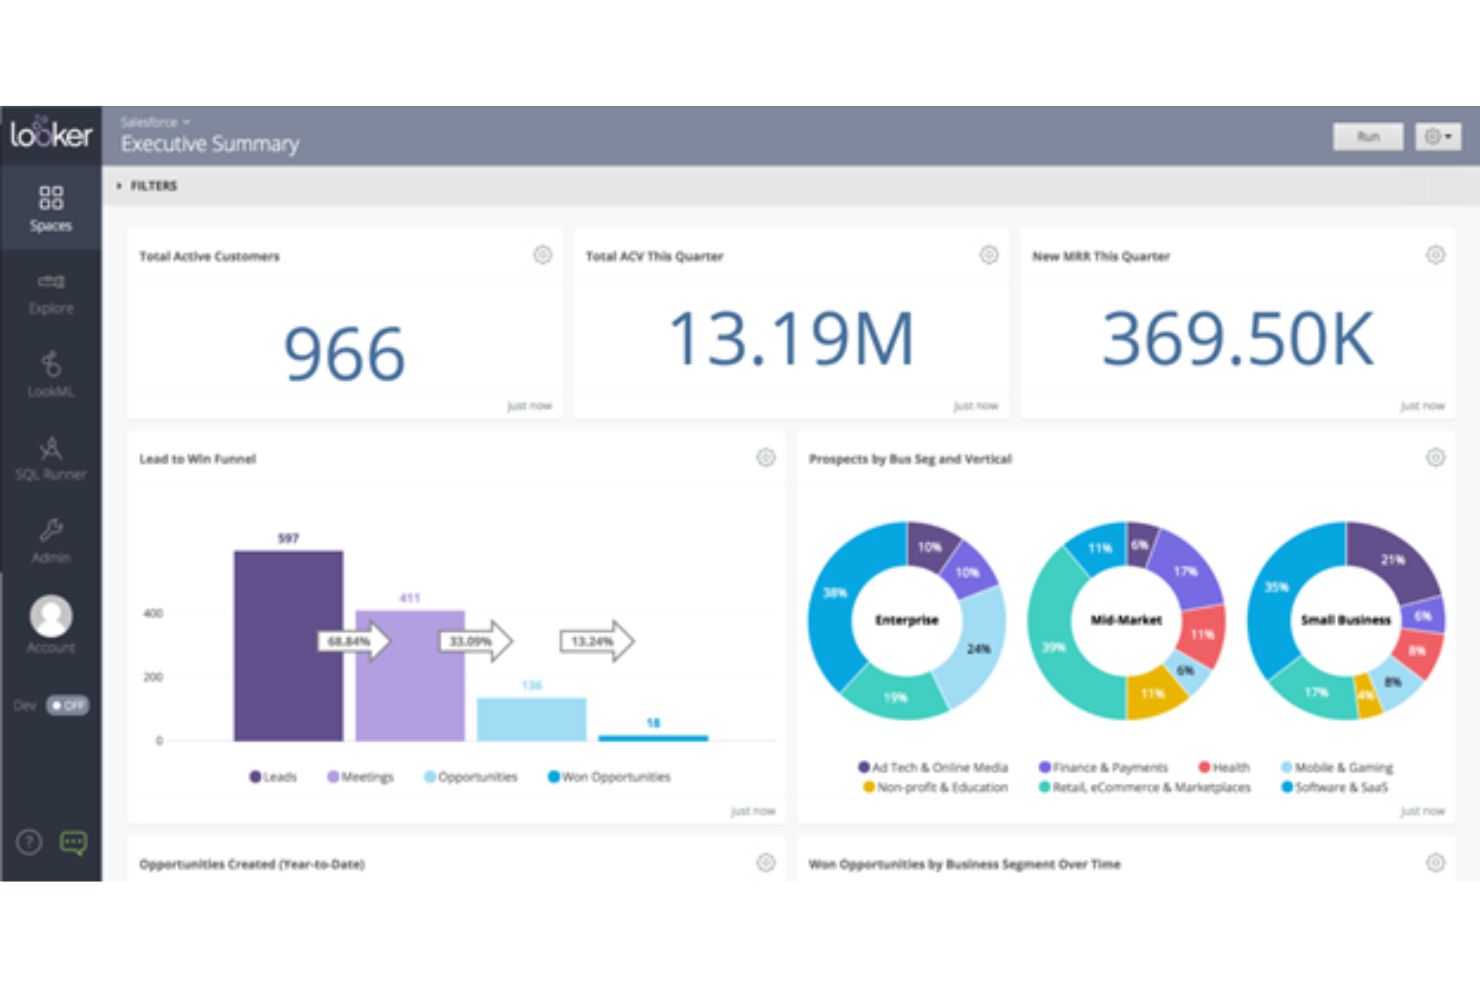
Now a part of Google Cloud, Looker is a BI platform that strives to ensure an intuitive approach of data exploration to end users. With the web-based interface, Looker enables you to build and share reports so that your organization can develop insight-powered workflows.
Why I picked Looker: This tool seemed to be particularly valuable for its close association with Google. The platform is built on Google Cloud infrastructure and is available as a service to integrate with any existing cloud portfolio in the Google Cloud console to ensure you have an accessible place to start and manage Looker instances.
Looker Standout Features and Integrations
Standout features include LookML that creates SQL queries on behalf of users and Looker Studio that connects you to a semantic model for analysis, exploration, and visualization.
Integrations include Asana, Dropbox Business, Google Analytics 360, Google Workspace, HubSpot, Mailchimp, Microsoft Excel, Rippling, Salesforce, and Slack.
Pros and Cons
Pros:
- Free tools are available
- Intuitive navigation and learning process
- User-friendly design and interface
Cons:
- Mostly online support through forums and FAQs
- Delayed performance for large data sets
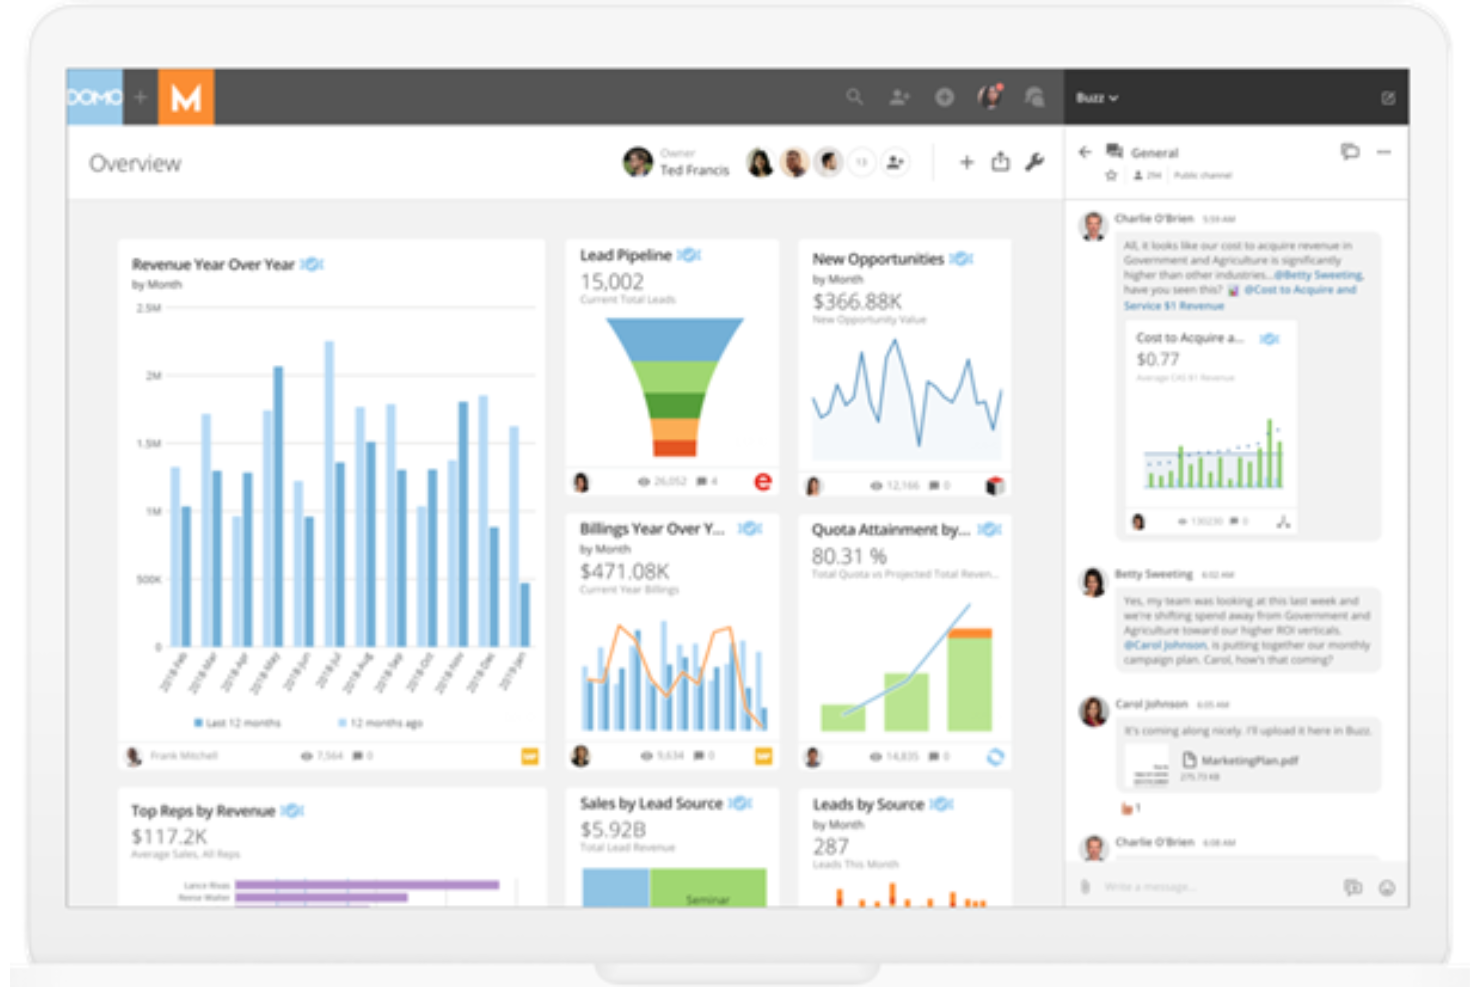
With its self-service reporting and analytics features, Domo can multiply the impact of analytics on your business by getting everyone involved with this cloud-native platform. It goes beyond traditional BI to make data more visible, actionable, and user-friendly through intuitive dashboards and apps, helping you optimize business processes at scale.
Why I picked Domo: While this should be an industry standard, this tool caught my eye because it prioritizes the shift from static data to real-time data with automated reporting that constantly gets fed a stream of fresh information to ensure accuracy no matter when or where you’re looking at your reporting.
Domo Standout Features and Integrations
Standout features include drag-and-drop ETL tools that make it easier to pull data from multiple sources and automated report scheduling to send updates to key stakeholders.
Integrations include Basecamp, DocuSign, Dropbox Business, GitHub, Google Analytics 365, Google Drive, Mailchimp, Microsoft Excel, SurveyMonkey, and Trello.
Pros and Cons
Pros:
- Customizable user interface
- OOB connector is simple to use
- Easy to build visualizations
Cons:
- Non-technical customer support
- No ability to link data sets
This self-service BI platform is built to ensure you can make faster business decisions with tools that help explore data and share insights in minutes. With intuitive visualizations, mobile accessibility, unlimited data sources, and drag-and-drop functionality, anyone in your organization can analyze and showcase relevant metrics with versatile reporting tools.
Why I picked MicroStrategy: I chose this platform because it offers an easier way to query your data. Instead of dealing with SQL complexity, MicroStrategy can automatically generate accurate SQL queries to answer business questions. This feature uses natural language processing to translate plain text into SQL for you.
MicroStrategy Standout Features and Integrations
Standout features include versatile data connectors that can ensure you have access to unlimited sources and AI-powered chatbot that can help explain the data they’re seeing to your team.
Integrations include Amazon Redshift, Cloudera, databricks, Google, Microsoft 365, Microsoft Excel, MongoDB, Salesforce, Snowflake, and Vibe.
Pros and Cons
Pros:
- Flexible and robust BI tool
- Intuitive navigation and interface
- Easy to understand tools
Cons:
- Costs can be higher than average
- Older interface designed years ago
As part of the IBM family of business intelligence products, Cognos Analytics is tailored to provide solutions to organizations of all shapes and sizes with standard BI features and advanced solutions, including ad hoc reporting, real-time monitoring, strategy management, performance scorecards, and forecasting. Use this tool to automate workflows and integrations.
Why I picked Cognos Analytics: The reason this platform caught my eye is because of its web-based versatility. With web access on any device, you can more easily upload, join, connect, and model data from a variety of sources using decision trees, predictive forecasting, and AI assistants.
Cognos Analytics Standout Features and Integrations
Standout features include built-in AI to accelerate data prep, automated data exploration to surface hidden insights, and collaboration tools to share data visualizations.
Integrations include CommandCenterHD, eCMS, Husky Intelligence, Key Survey, Limelight, LoginERP, MongoDB, SAP Fieldglass, Slack, and VisualCron.
Pros and Cons
Pros:
- AI-driven data visualization
- Easy to automate and schedule tasks
- No need to know SQL
Cons:
- Performance lag with large data sets
- Joining data sources can be clunky
As an artificial intelligence-driven BI platform, Salesforce Einstein Analytics delivers a feature-rich data visualization and analysis solution with end-to-end capabilities. Utilize the power of AI to analyze billions of data combinations across marketing, service, and sales for smarter, faster decision-making.
Why I picked Einstein Analytics Platform: This tool made my list because it has a feature called Einstein Actions. Now, you can take action more quickly the moment you gain a new insight with built-in functionality for creating tasks, sharing insights, and updating records without having to wait for legacy technology to catch up.
Einstein Analytics Platform Standout Features and Integrations
Standout features include a mobile-first approach that makes Einstein accessible on any device, even smart watches, and contextual dashboards through Tableau to embed visualizations across the platform.
Integrations include Accounting Seed, Conga Grid, Oracle, RollUp Helper, SAP, SurveyMonkey, Tableau, Viostream, Wave, and Whatfix.
Pros and Cons
Pros:
- Friendly and accessible customer support
- Easy to set up using a “Trailhead”
- Designed to be versatile across various industries
Cons:
- Limited data that you can use
- Requires a limited analytics license
Best for versatile implementation on-premise or in the cloud
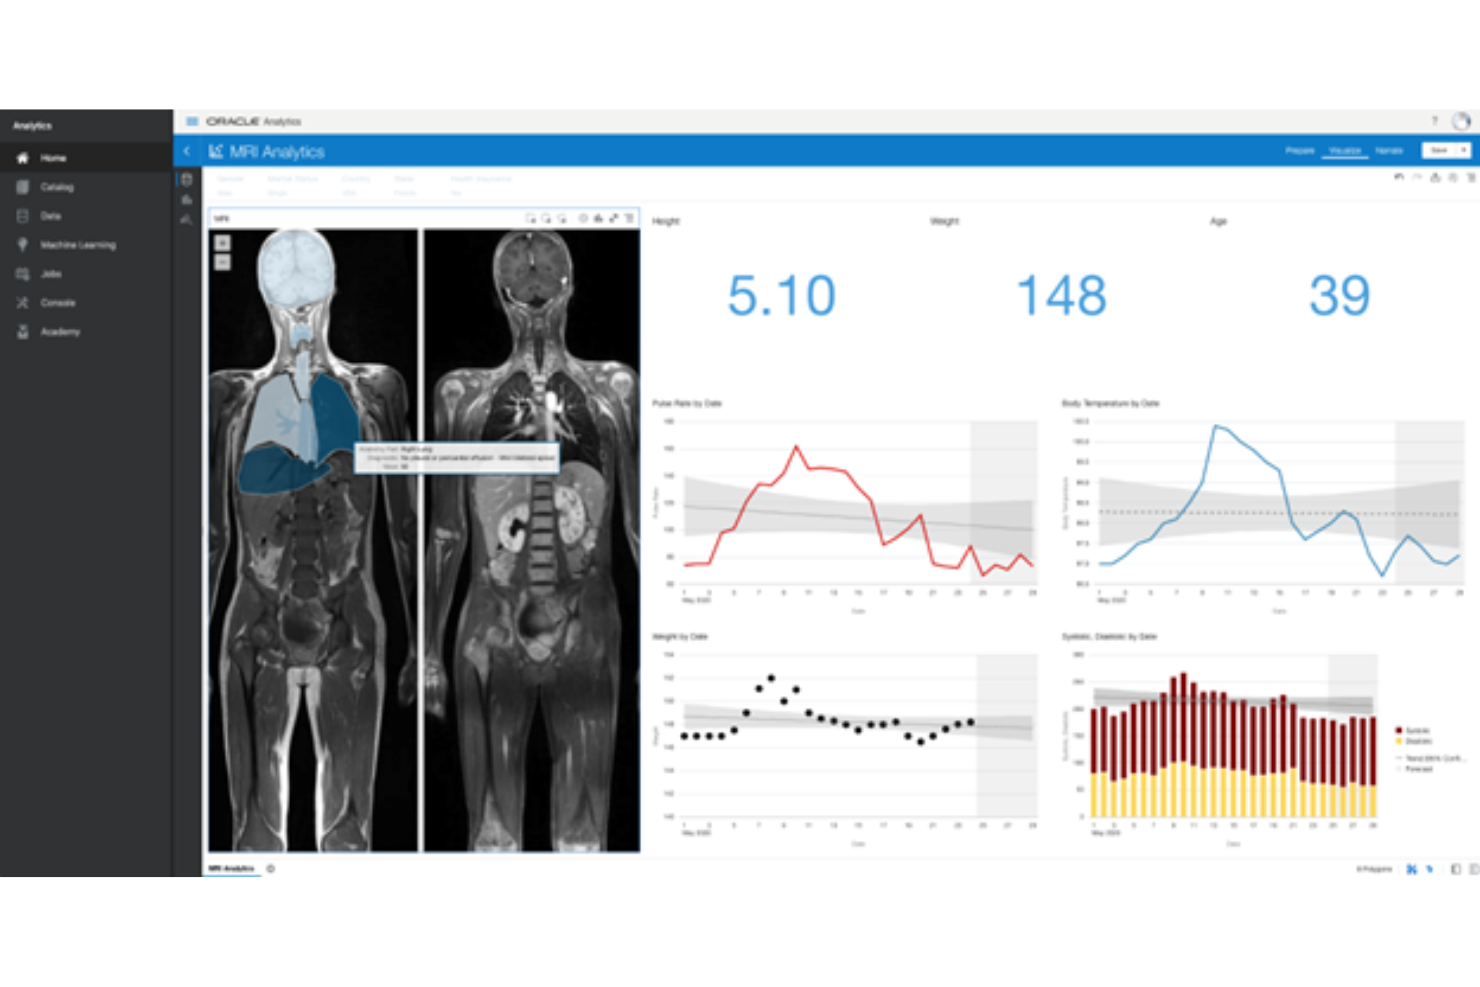
This cloud native BI service is designed to help your organization discover and unlock actionable insights from your data through powerful data preparation and enrichment, as well as data visualization and embedded machine learning. Oracle Analytics Cloud provides on-premise, cloud, and hybrid deployment strategies.
Why I picked Oracle Analytics Cloud: I like this platform because it offers flexible implementation options to meet your needs. While many smaller businesses that can’t afford hardware costs may prefer cloud implementation, enterprise organizations who prefer more control over their data can opt for on-premise deployment.
Oracle Analytics Cloud Standout Features and Integrations
Standout features include machine learning capabilities to surface hidden insights, autonomous data warehouse to optimize analytic workloads, and a mobile app that can learn from your behaviors and make recommendations.
Integrations include Accountagility ORYX, DataTerrain, Espresso, iOS14, Kodiak Hub, Microsoft Azure, Microsoft PowerPoint, Rayven, TSM, and VKS.
Pros and Cons
Pros:
- User-friendly interface design
- Very accessible with limited coding requirements
- You need minimal training to use it
Cons:
- Limited scaling up and down instances
- Limited customization options
Other Self-Service BI Tools
Here are some additional self-service BI tools options that didn’t make it onto my shortlist, but are still worth checking out:
- Microsoft Power BI
For turning data into visualizations using AI
- Networked BI
For delivering data as a service (DaaS)
- Qlik Analytics Platform
For supporting developers with direct access to the Qlik Associative Engine
- Pyramid Analytics
For augmented consumer and business analyst use cases
- AnswerRocket
For an AI assistant that’s powered by GPT-4
- SAP Analytics Cloud
Advanced analytics tools with smooth access to heterogeneous data sources
- ThoughtSpot
Business intelligence software for an intuitive, Google-like search user interface
- Sisense
Versatile solution for all teams with pro-code, low-code, and no-code options
- Yellowfin BI
For interactive visualizations and action-based dashboards based on AI-assisted analytics
- Tableau Desktop
For building a data-driven culture with decision-making inspired by analytics


Self-Service BI Tool Selection Criteria
When selecting the best self-service BI tools to include in this list, I considered common buyer needs and pain points like ease of use and data integration capabilities. I also used the following framework to keep my evaluation structured and fair:
Core Functionality (25% of total score)
To be considered for inclusion in this list, each solution had to fulfill these common use cases:
- Generate reports and dashboards
- Support ad-hoc analysis
- Provide data visualization
- Allow data exploration
- Enable data sharing and collaboration
Additional Standout Features (25% of total score)
To help further narrow down the competition, I also looked for unique features, such as:
- Natural language processing
- AI-driven insights
- Mobile accessibility
- Customizable dashboards
- Real-time data analysis
Usability (10% of total score)
To get a sense of the usability of each system, I considered the following:
- Intuitive interface
- Easy navigation
- Minimal learning curve
- Responsive design
- Consistency in user experience
Onboarding (10% of total score)
To evaluate the onboarding experience for each platform, I considered the following:
- Availability of training videos
- Interactive product tours
- Access to templates
- Supportive chatbots
- Scheduled webinars
Customer Support (10% of total score)
To assess each software provider’s customer support services, I considered the following:
- 24/7 availability
- Multiple support channels
- Response time
- Knowledgeable staff
- Access to a help center
Value For Money (10% of total score)
To evaluate the value for money of each platform, I considered the following:
- Competitive pricing
- Flexible subscription plans
- Transparent pricing model
- Features included in base price
- Discounts for larger teams
Customer Reviews (10% of total score)
To get a sense of overall customer satisfaction, I considered the following when reading customer reviews:
- Overall satisfaction rating
- Frequency of updates
- Commonly praised features
- Reported issues or bugs
- Feedback on customer support
How to Choose Self-Service BI Tool
It’s easy to get bogged down in long feature lists and complex pricing structures. To help you stay focused as you work through your unique software selection process, here’s a checklist of factors to keep in mind:
| Factor | What to Consider |
|---|---|
| Scalability | Will the tool grow with your business? Consider if it can handle increased data volume and users. Look for flexible plans that match your growth trajectory. |
| Integrations | Does it connect with your existing systems? Ensure it supports your CRM, ERP, or other essential software. Check for API availability and partner ecosystems. |
| Customizability | Can you tailor it to fit your workflow? Look for tools that allow custom dashboards and reports. Beware of rigid solutions that don’t adapt to your needs. |
| Ease of use | Is it user-friendly for your team? Test the interface for intuitiveness and simplicity. Avoid tools with steep learning curves. |
| Implementation and onboarding | How quickly can you get started? Consider the availability of training resources, support during setup, and the time required to get up and running. |
| Cost | Is it within your budget? Analyze the total cost of ownership, including hidden fees or charges for additional features. Compare value against competitors. |
| Security safeguards | Does it protect your data? Ensure it meets industry standards for encryption and data privacy. Check for compliance with regulations like GDPR if applicable. |
What Are Self-Service BI Tools?
Self-service BI (Business Intelligence) tools are software applications that enable non-technical users to access, analyze, and visualize data independently. These tools offer a user-friendly interface, data visualization capabilities, and drag-and-drop functionalities for report creation and analysis. They integrate various data sources and provide real-time data access, allowing users across an organization to perform their own data analysis and reporting.
Features
When selecting self-service BI tools, keep an eye out for the following key features:
- Data visualization: Enables users to create visual representations of data, making it easier to interpret complex information quickly.
- Ad-hoc reporting: Allows users to generate reports on-the-fly, providing flexibility to analyze data as needed without predefined templates.
- User-friendly interface: Ensures that the tool is accessible to non-technical users, reducing the learning curve and increasing adoption.
- Customizable dashboards: Lets users tailor their dashboards to display the most relevant data, enhancing their ability to monitor key metrics.
- Data integration: Supports connections to various data sources, ensuring seamless data flow and comprehensive analysis.
- Natural language processing: Allows users to interact with data using natural language queries, simplifying the data exploration process.
- Mobile accessibility: Provides access to data and insights on mobile devices, enabling decision-making on-the-go.
- Real-time data analysis: Offers insights based on the latest data, allowing users to make timely and informed decisions.
- AI-driven insights: Utilizes artificial intelligence to provide predictive analytics and uncover hidden trends in the data.
- Security safeguards: Ensures data privacy and protection, meeting industry standards and regulatory requirements.
Benefits
Implementing self-service BI tools provides several benefits for your team and your business. Here are a few you can look forward to:
- Faster decision-making: With real-time data analysis, your team can make informed decisions quickly without waiting for reports.
- Increased accessibility: User-friendly interfaces and mobile access ensure everyone on your team can access insights anytime, anywhere.
- Enhanced collaboration: Data sharing capabilities allow your team to work together on insights and strategies more effectively.
- Greater flexibility: Customizable dashboards and ad-hoc reporting let users tailor the tool to their specific needs and queries.
- Empowered users: Natural language processing and AI-driven insights enable non-technical users to explore data and uncover trends independently.
- Improved data accuracy: Integration with various data sources ensures that your analyses are based on comprehensive and up-to-date information.
Costs & Pricing
Selecting self-service BI tools requires an understanding of the various pricing models and plans available. Costs vary based on features, team size, add-ons, and more. The table below summarizes common plans, their average prices, and typical features included in self-service BI tools solutions:
Plan Comparison Table for Self-Service BI Tools
| Plan Type | Average Price | Common Features |
|---|---|---|
| Free Plan | $0 | Basic data visualization, limited data sources, and community support. |
| Personal Plan | $10-$30/user/month | Ad-hoc reporting, customizable dashboards, and email support. |
| Business Plan | $30-$60/user/month | Advanced data integration, mobile access, and priority support. |
| Enterprise Plan | $60-$120/user/month | AI-driven insights, dedicated account manager, and comprehensive security features. |
Self-Service BI Tools FAQs
Here are some answers to common questions about self-service BI tools:
What is the difference between self-service BI tools and traditional BI tools?
Self-service BI tools allow users without technical expertise to access and analyze data independently, whereas traditional BI tools often require IT involvement for report generation. Self-service tools are user-friendly, enabling quick insights and decisions, while traditional tools are typically more complex and IT-centric.
Can self-service BI tools handle large datasets?
Yes, many self-service BI tools can handle large datasets, but their performance depends on the tool’s architecture and your system’s resources. Look for tools with scalable data processing capabilities and ensure they integrate well with your existing data infrastructure to manage large volumes efficiently.
How do self-service BI tools integrate with other software?
Self-service BI tools typically offer API connections or pre-built integrations with popular software like CRMs, ERPs, and databases. Before choosing a tool, check its compatibility with your existing systems to ensure seamless data flow and avoid potential integration challenges.
How do you test scalability in self-service BI tools?
Run queries on large datasets to see how the tool handles heavy workloads. Test dashboard load times and monitor performance as more users access the system.
How can you track usage and adoption of self-service BI tools?
Use the tool’s built-in analytics to see who’s building reports and which dashboards get the most views. These insights help you adjust training and boost team adoption.
What’s Next:
If you're in the process of researching self-service BI tools, connect with a SoftwareSelect advisor for free recommendations.
You fill out a form and have a quick chat where they get into the specifics of your needs. Then you'll get a shortlist of software to review. They'll even support you through the entire buying process, including price negotiations.