12 Mejores Alternativas a Looker para 2026

Lista corta de alternativas a Looker


Una buena alternativa a Looker brinda a tu equipo un modelado de datos flexible, visualización de datos intuitiva e integración fiable con tu pila de datos existente. Si buscas las mejores alternativas a Looker, probablemente estés considerando el costo, la escalabilidad o características analíticas específicas que se adapten mejor a tus necesidades de inteligencia empresarial y análisis de datos. Muchos equipos también evalúan herramientas capaces de manejar datos complejos, admitir múltiples formatos de informes y ofrecer capacidades de pronóstico minimizando la curva de aprendizaje. Esta lista te ayudará a comparar las principales plataformas de BI y analítica —incluyendo opciones similares a Looker Studio— para que puedas elegir con confianza una solución que se adapte a tu estrategia de datos, flujos de trabajo de informes y planes de crecimiento.
¿Qué es Looker?
Looker es una herramienta de inteligencia empresarial y una plataforma de análisis de datos que ayuda a los equipos a explorar, analizar y visualizar datos provenientes de múltiples fuentes. Ofrece una capa de modelado llamada LookML, que permite a los usuarios definir métricas y relaciones para obtener informes consistentes. Looker permite crear paneles de control personalizados, informes interactivos y se integra con almacenes de datos en la nube, lo que la convierte en una opción popular para organizaciones que gestionan grandes volúmenes de datos. Con sus funciones avanzadas y una interfaz relativamente fácil de usar, Looker mejora la experiencia general del usuario al tiempo que respalda la toma de decisiones basada en datos y la analítica centralizada, escalable y gobernada.
Por Qué Confiar en Nuestras Reseñas de Software
Hemos estado probando y revisando software RevOps desde 2022. Como líderes en RevOps, sabemos lo crítico y difícil que es tomar la decisión correcta al seleccionar software. Invertimos en una investigación profunda para ayudar a nuestra audiencia a tomar mejores decisiones de compra de software. Hemos probado más de 2.000 herramientas para diferentes casos de uso de RevOps y escrito más de 1.000 reseñas de software exhaustivas. Conozca cómo mantenemos la transparencia y nuestra metodología de evaluación de software.
Resumen de las mejores alternativas a Looker
Esta tabla de comparación resume los detalles de precios de mis principales selecciones de alternativas a Looker para ayudarte a encontrar la mejor opción para tu presupuesto y necesidades de negocio.
| Tool | Best For | Trial Info | Price | ||
|---|---|---|---|---|---|
| 1 | Best for interactive visual analytics | Free plan available | From $15/user/month (billed annually) | Website | |
| 2 | Best for automated data pipeline workflows | 14-day free trial + free demo available | From $800/10 users/month (billed biennially) | Website | |
| 3 | Best for collaborative SQL analytics | Free trial + free demo available | From $25/user/month (billed annually) | Website | |
| 4 | Best for real-time data dashboards | 30-day free trial + free demo available | Pricing upon request | Website | |
| 5 | Best for open-source self-service reporting | Free plan available | From $100/month (billed monthly) + $6/user/month | Website | |
| 6 | Best for embedded analytics in applications | Free plan available | Pricing upon request | Website | |
| 7 | Best for search-driven data exploration | 14-day free trial + free demo available | From $25/user/month (billed annually) | Website | |
| 8 | Best for spreadsheet-style cloud analytics | Free demo available | Pricing upon request | Website | |
| 9 | Best with Microsoft 365 integration | Free trial + free plan available | From $14/user/month (billed annually) | Website | |
| 10 | Best for customizable open-source dashboards | Free forever | Free forever | Website |
-

Prisync
Visit WebsiteThis is an aggregated rating for this tool including ratings from Crozdesk users and ratings from other sites.4.7 -
Expedite Commerce
Visit Website -
QuickBooks Online
Visit WebsiteThis is an aggregated rating for this tool including ratings from Crozdesk users and ratings from other sites.4


Reseñas de alternativas a Looker
A continuación, encontrarás mis resúmenes detallados de las alternativas a Looker que he incluido en mi lista corta. Mis reseñas ofrecen un análisis exhaustivo de las características, integraciones y mejores casos de uso de cada plataforma para ayudarte a encontrar la mejor opción para tu empresa.
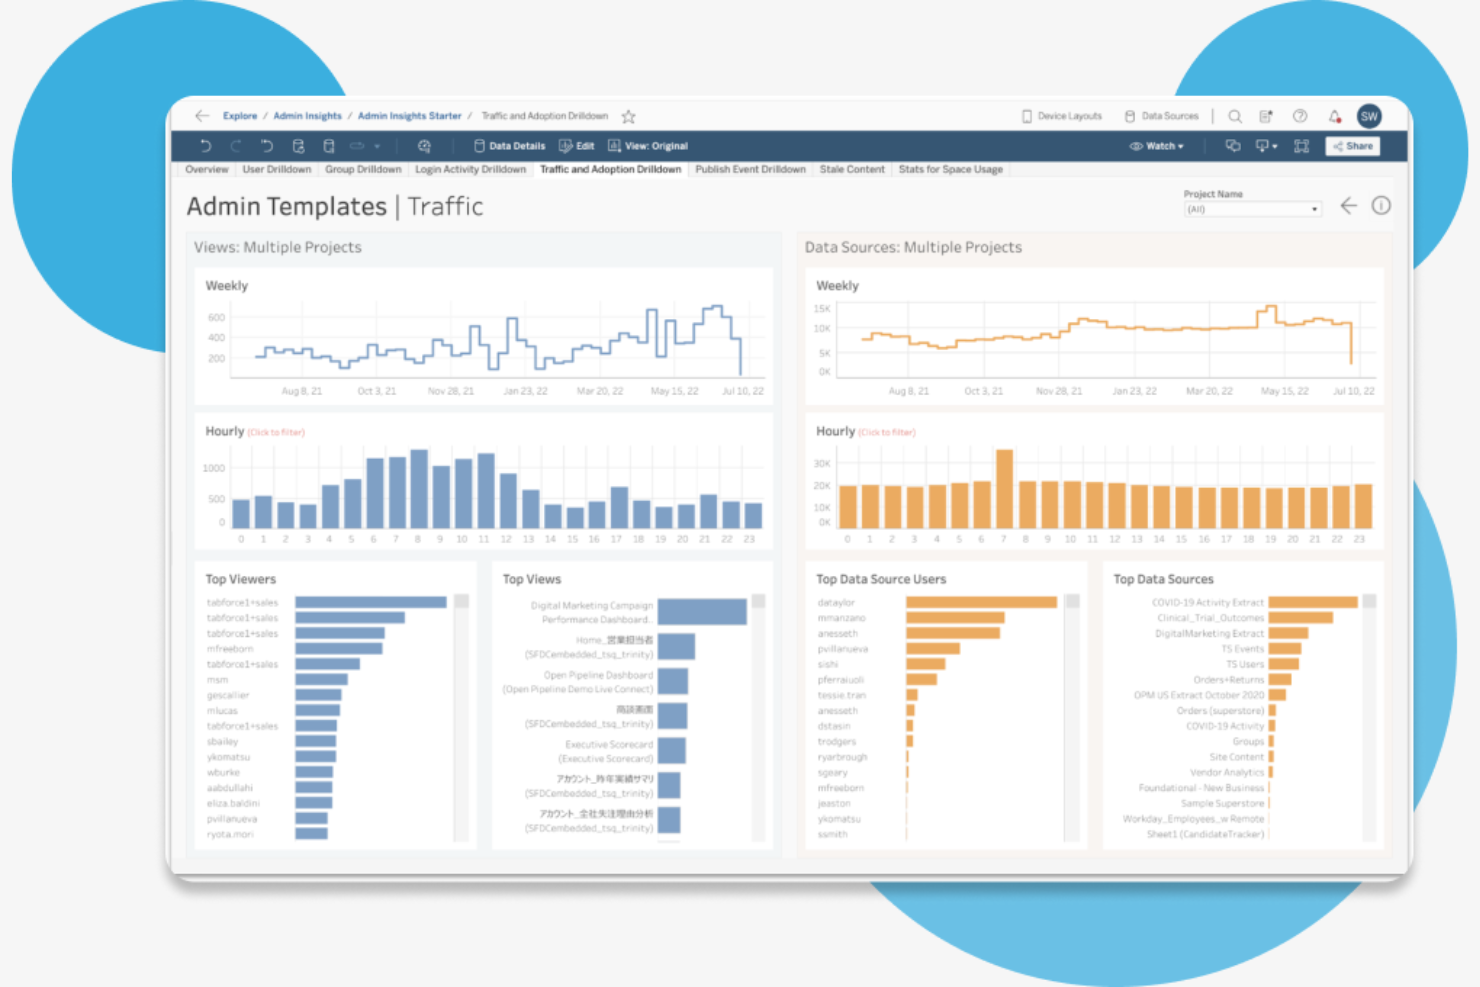
Tableau stands out for teams that need highly interactive and visually rich analytics. It’s a strong fit for data analysts and business users who want to build custom dashboards and explore data with drag-and-drop tools. Tableau’s visual approach helps organizations uncover trends and insights that might be harder to spot in more code-driven platforms like Looker.
Why Tableau Is a Good Looker Alternative
Tableau offers a level of interactive visual analytics that’s hard to match in other platforms. I picked Tableau for its dynamic dashboard capabilities, which let users filter, drill down, and manipulate data in real time. Its drag-and-drop interface makes it easy to build complex visualizations without writing code. For teams that prioritize visual exploration and storytelling with data, Tableau provides a flexible and engaging alternative to Looker’s more model-driven approach.
Tableau Key Features
Some other features in Tableau that are useful for business intelligence and analytics teams include:
- Data Prep with Tableau Prep: Prepare, clean, and shape data visually before analysis using a dedicated data preparation tool.
- Live and In-Memory Data Connections: Connect to data in real time or use in-memory extracts for faster performance and flexibility.
- Advanced Calculations: Build custom calculations and statistical models directly within dashboards using a formula editor.
- Mobile-Optimized Dashboards: Design dashboards that automatically adjust for mobile devices, making analytics accessible on the go.
Tableau Integrations
Integrations include Salesforce CRM, Snowflake, Google BigQuery, Amazon Redshift, Microsoft SQL Server, SAP HANA, Google Cloud, Databricks, and more.
Pros and Cons
Pros:
- Flexible sharing and publishing options
- Extensive library of pre-built data connectors
- Strong support for real-time data connections
Cons:
- No built-in data transformation scripting
- Limited version control for dashboard changes
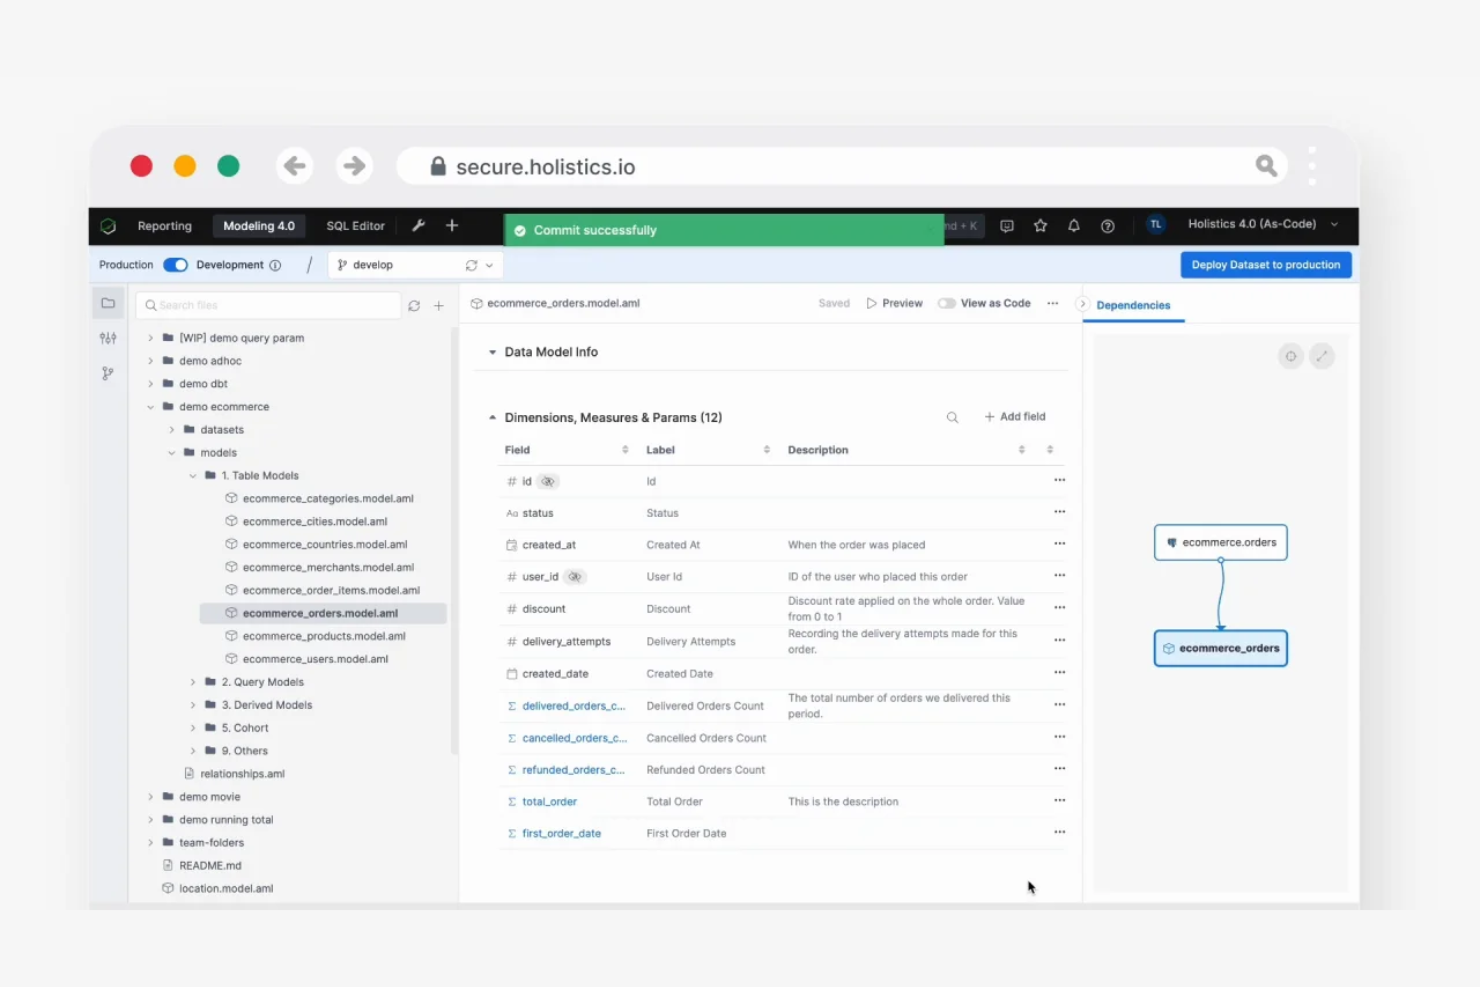
Holistics is built for data teams that want to automate and manage data pipeline workflows without heavy engineering resources. It appeals to analytics professionals and operations leaders who need to model, transform, and deliver data across teams with minimal manual intervention. The platform’s code-based modeling and automated scheduling set it apart from Looker by giving users more control over data preparation and delivery.
Why Holistics Is a Good Looker Alternative
Unlike Looker, Holistics puts automated data pipeline workflows at the center of its platform. I picked Holistics because it lets you define data models and transformation logic using code, then schedule and orchestrate those workflows without relying on external tools. The platform’s data modeling layer supports reusable logic and version control, making it easier to manage complex analytics projects. If you want to automate data prep and delivery as part of your business intelligence process, Holistics gives you more flexibility and control than most traditional BI tools.
Holistics Key Features
Some other features in Holistics that are useful for analytics teams include:
- Self-Service Reporting: Business users can explore and build their own reports without writing SQL.
- Data Alerts: Set up automated notifications based on data thresholds or anomalies.
- White-Labeling: Customize dashboards and reports with your company’s branding.
- Row-Level Security: Control data access for different users or groups within your organization.
Holistics Integrations
Native integrations are not currently listed.
Pros and Cons
Pros:
- Data alerts notify users of anomalies instantly
- White-labeling for branded dashboards and reports
- Self-service reporting for non-technical users
Cons:
- No built-in semantic layer for business logic
- No drag-and-drop dashboard builder available
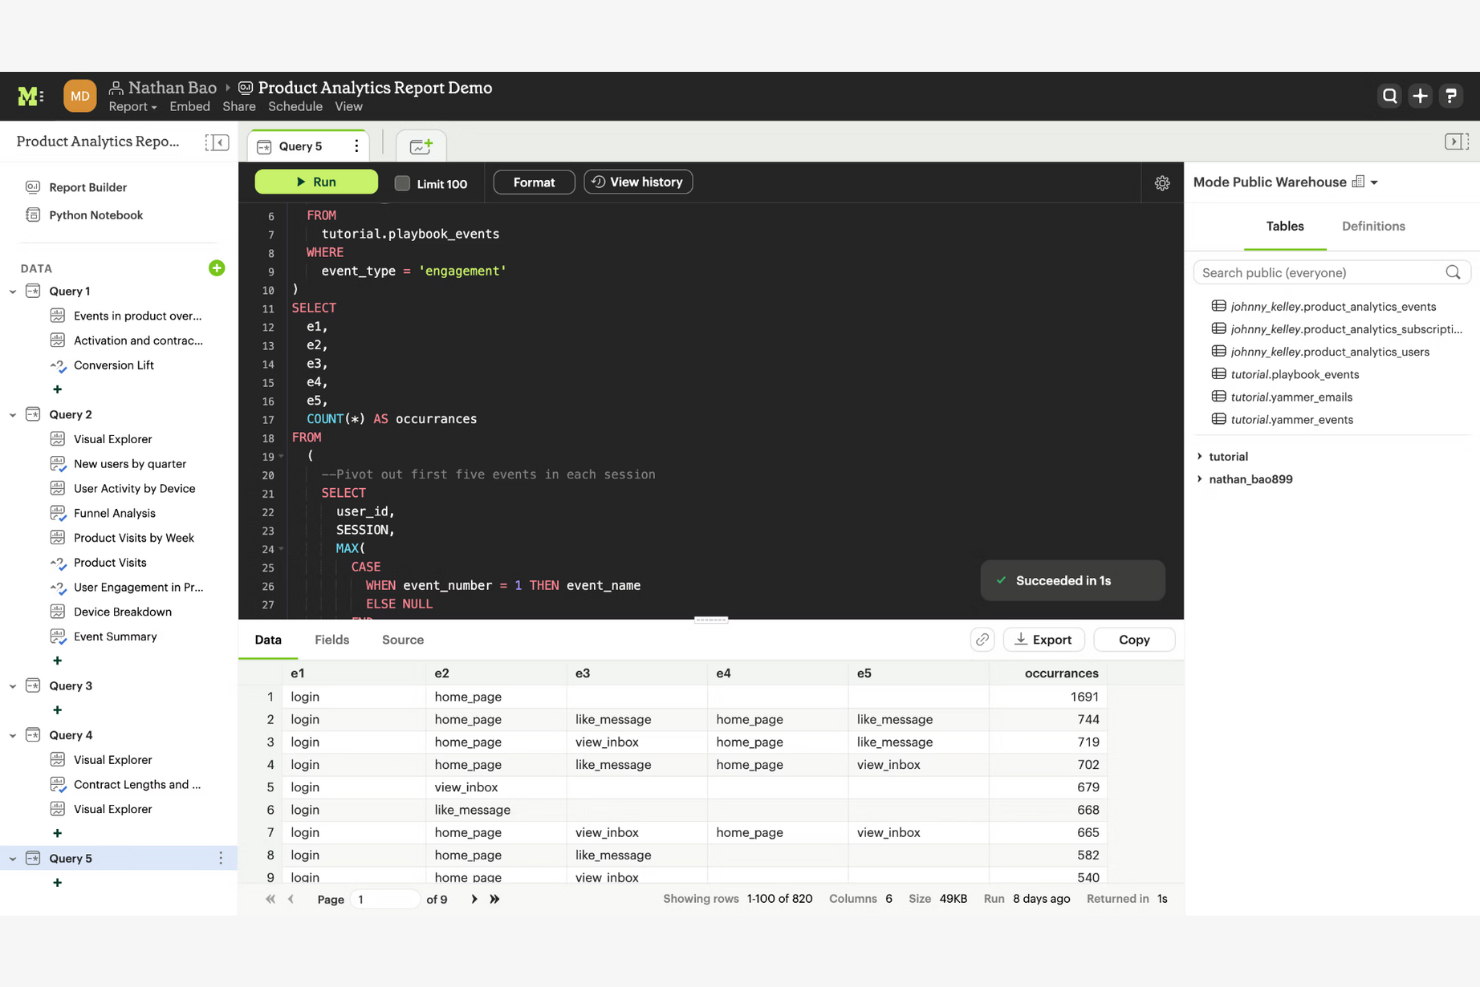
Data teams that prioritize collaboration and SQL-driven analysis often choose Mode for their analytics workflows. Mode is designed for analysts and business users who need to work together on queries, reports, and dashboards in real time. Its focus on shared SQL workspaces and integrated Python and R notebooks makes it a strong fit for organizations that want to blend code-based analytics with interactive business intelligence.
Why Mode Is a Good Looker Alternative
For teams that need to collaborate on SQL analytics, Mode offers a different approach than Looker. I picked Mode because it lets multiple users write, edit, and share SQL queries in real time, making it easy to build and refine analyses as a group. The platform also supports integrated Python and R notebooks, so you can extend your SQL work with advanced analytics and visualizations. If your team values hands-on, code-driven collaboration, Mode provides a flexible environment that supports both technical and business users.
Mode Key Features
Some other features in Mode that are valuable for analytics teams include:
- Report Scheduling: Automate the delivery of reports to stakeholders on a recurring basis.
- Drag-and-Drop Visualization Builder: Create charts and dashboards without writing code.
- Data Source Connections: Connect directly to cloud data warehouses like Snowflake, Redshift, and BigQuery.
- Version History: Track changes and revert to previous versions of reports and queries.
Mode Integrations
Integrations include Amazon Redshift, Snowflake, Google BigQuery, Databricks, Microsoft SQL Server, PostgreSQL, MySQL, Oracle, Presto, and Slack.
Pros and Cons
Pros:
- Version history tracks all report changes
- Integrated Python and R notebooks for analysis
- Real-time SQL collaboration for multiple users
Cons:
- No native embedded analytics for external apps
- Requires SQL knowledge for most workflows
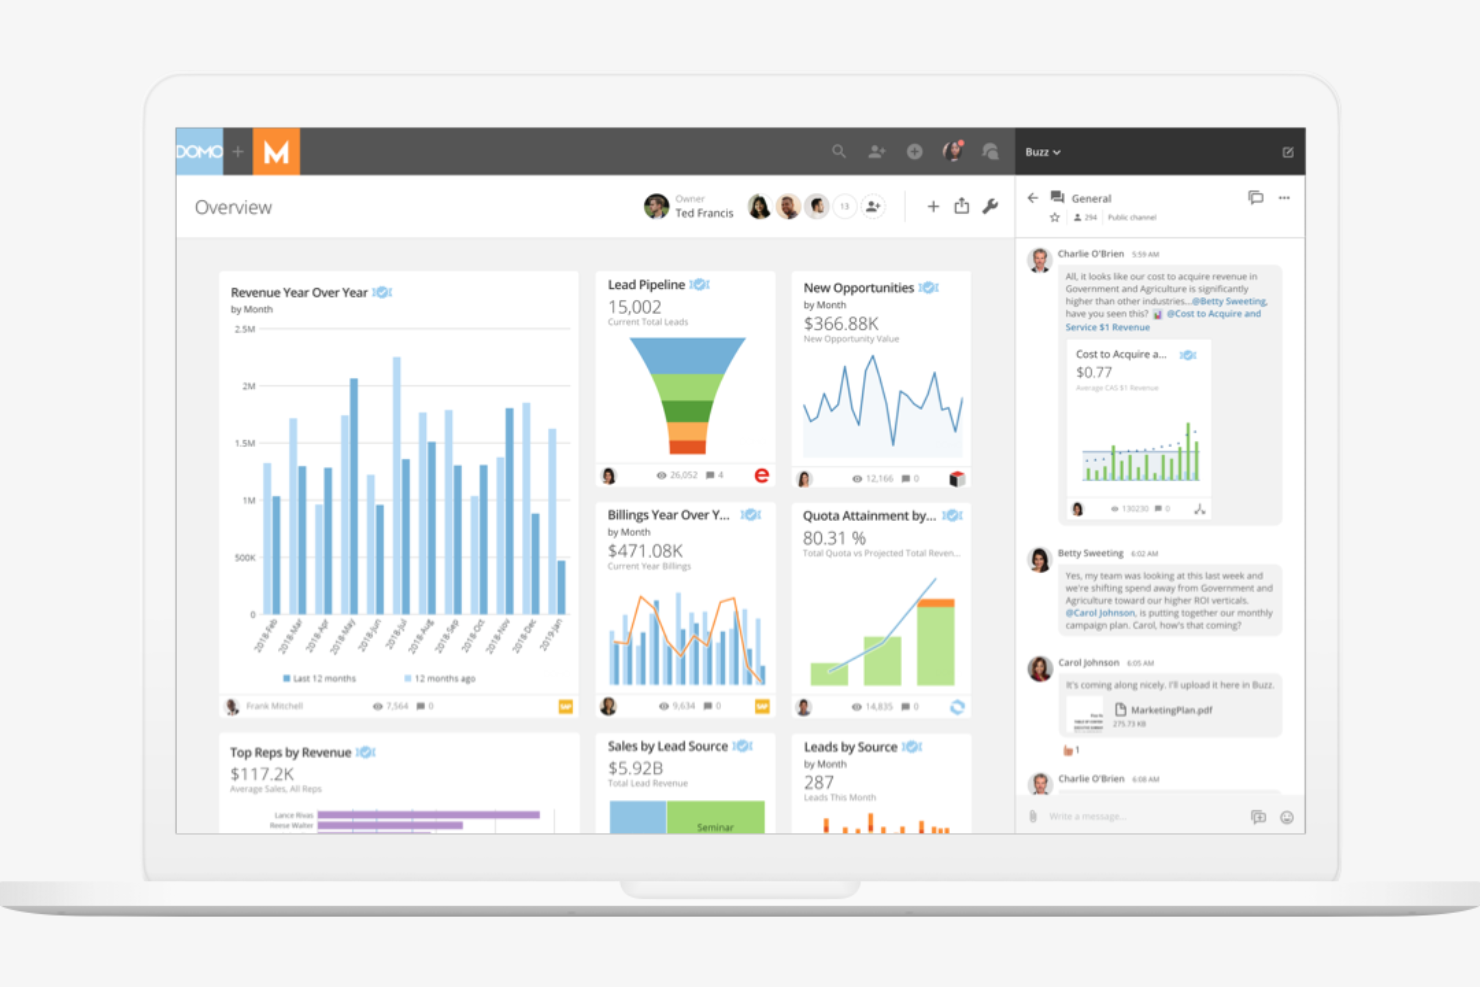
When you need live, always-up-to-date dashboards, Domo is built to deliver. Domo is a strong fit for operations, sales, and marketing teams that rely on real-time data to make fast decisions. Its streaming data connectors and auto-refreshing dashboards help you monitor business performance minute by minute, without manual updates.
Why Domo Is a Good Looker Alternative
Unlike Looker, Domo is purpose-built for teams that need real-time visibility into their data. I picked Domo because its streaming data connectors and auto-refreshing dashboards let you see up-to-the-minute changes without manual intervention. Domo’s alerting system also notifies you instantly when key metrics cross thresholds, so you can act quickly. If your business depends on live data to drive decisions, Domo’s real-time dashboard capabilities set it apart.
Domo Key Features
Some other features in Domo that are useful for analytics teams include:
- Magic ETL Data Pipeline: Build and automate data transformation workflows with a drag-and-drop interface.
- App Studio: Create custom data apps and visualizations tailored to your business needs.
- Mobile Access: View and interact with dashboards and reports from any mobile device.
- Data Governance Tools: Manage permissions, data lineage, and compliance across your organization.
Domo Integrations
Integrations include Snowflake, Databricks, Amazon Redshift, BigQuery, Oracle NSAW, and more.
Pros and Cons
Pros:
- App Studio for building custom data apps
- Extensive library of prebuilt data connectors
- Magic ETL for visual data transformation
Cons:
- Limited support for on-premises data sources
- Dataflow versioning can be difficult to manage
Open-source teams looking for self-service analytics often turn to Metabase for its flexibility and transparency. Metabase appeals to organizations that want to host their own BI platform and customize reporting without vendor lock-in. Its open-source foundation and intuitive query builder make it easy for non-technical users to explore data and create dashboards on their own terms.
Why Metabase Is a Good Looker Alternative
Unlike many proprietary BI tools, Metabase gives you full control through its open-source model, making it a strong choice for teams that want to self-host and customize their analytics environment. I picked Metabase because it lets you modify the source code, tailor the platform to your organization’s needs, and avoid vendor lock-in. Its visual query builder allows non-technical users to create and share reports without writing SQL. For businesses that value transparency and flexibility in their analytics stack, Metabase offers a unique alternative to Looker.
Metabase Key Features
Some other features in Metabase that are useful for analytics teams include:
- Automated Dashboard Subscriptions: Schedule dashboards to be delivered to users’ inboxes on a recurring basis.
- Data Model Editor: Define and manage metadata, relationships, and field descriptions directly within the platform.
- Audit Logs: Track user activity and changes to questions, dashboards, and settings for compliance and troubleshooting.
- Embedded Analytics: Integrate interactive charts and dashboards into your own applications or customer portals.
Metabase Integrations
Integrations include Amazon Redshift, BigQuery, Snowflake, Databricks, PostgreSQL, MySQL, Microsoft SQL Server, MongoDB, Google Sheets, and Amazon Athena.
Pros and Cons
Pros:
- Visual query builder for non-technical users
- Self-hosting option for data privacy needs
- Open-source codebase for full platform control
Cons:
- Audit logging only available on paid plans
- No built-in support for LookML modeling
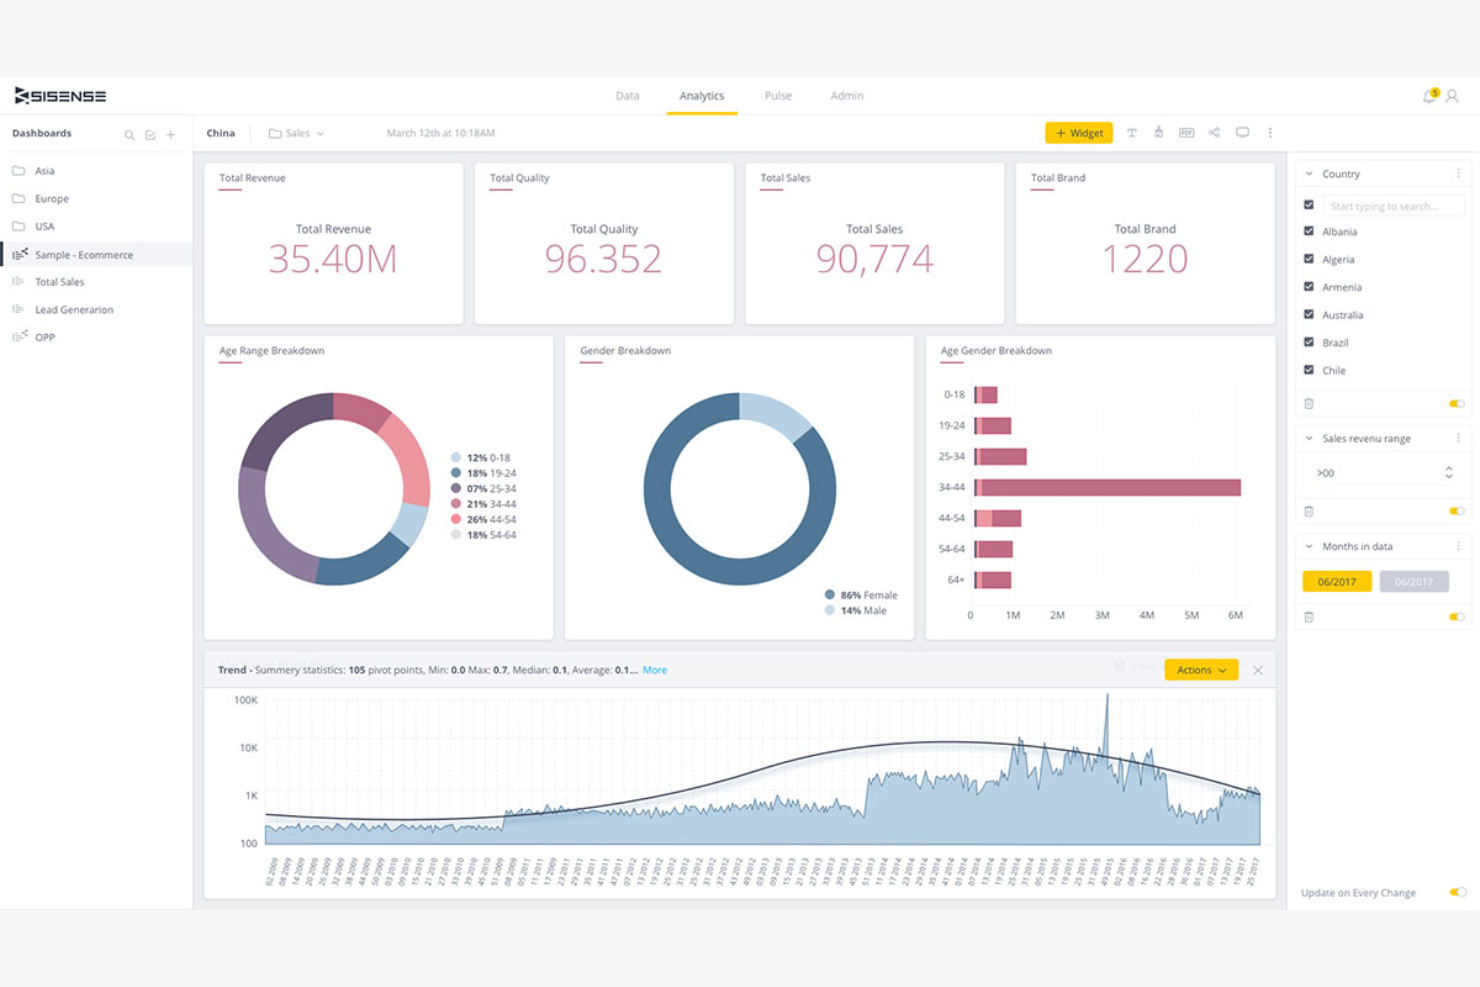
If you need to embed analytics directly into your product or customer-facing applications, Sisense is built for that purpose. Sisense appeals to SaaS companies and software teams that want to deliver interactive dashboards and analytics as part of their own platforms. Its flexible APIs and white-labeling options help you create a smooth analytics experience for your users without sending them to a separate BI tool.
Why Sisense Is a Good Looker Alternative
For teams focused on embedding analytics into their own products, Sisense offers a level of flexibility that Looker doesn’t match. I picked Sisense because it provides a full suite of APIs and SDKs for embedding dashboards, widgets, and even custom analytics workflows directly into web applications. Its white-labeling capabilities let you fully brand the analytics experience as your own, which is essential for SaaS and product teams. If you want to deliver analytics as a part of your platform, Sisense is purpose-built for that use case.
Sisense Key Features
Some other features in Sisense that are valuable for analytics teams include:
- Elasticube Data Engine: Build and manage high-performance data models for fast querying and analysis.
- AI-Driven Insights: Surface automated data trends and anomaly detection using built-in machine learning.
- Role-Based Access Controls: Set granular permissions for users, groups, and data assets.
- Scheduled Reporting: Automate the delivery of dashboards and reports to stakeholders on a recurring schedule.
Sisense Integrations
Integrations include Snowflake, Amazon Redshift, Google BigQuery, Azure Synapse, Salesforce, Google Analytics, PostgreSQL, MySQL, Microsoft SQL Server, and Oracle.
Pros and Cons
Pros:
- Handles large data sets
- Customizable dashboards
- Fast data processing
Cons:
- Can be resource-intensive
- Limited advanced analytics features
If you want to analyze data using natural language search, ThoughtSpot is designed for that experience. This cloud-native platform is a strong fit for business teams, analysts, and startups that need quick, self-serve answers from complex datasets without relying on technical experts. Its search-driven analytics let you type questions and instantly generate charts using built-in visualization tools. With strong analytics capabilities and integrations with data preparation tools like Power Query, ThoughtSpot helps teams explore and model data without needing a dedicated modeling language.
Why ThoughtSpot Is a Good Looker Alternative
For teams that want to explore data by asking questions in plain language, ThoughtSpot offers a unique approach compared to Looker. I picked ThoughtSpot because its search-driven analytics let you type queries and instantly generate visualizations, removing the need for complex report building. The platform’s AI-powered search suggestions help guide users to relevant insights, even if they’re not sure how to phrase their questions. If you want a tool that makes data exploration as simple as searching the web, ThoughtSpot is a strong alternative.
ThoughtSpot Key Features
Some other features in ThoughtSpot that are valuable for analytics teams include:
- Liveboard Dashboards: Create interactive, real-time dashboards that update as your data changes.
- SpotIQ AI Insights: Automatically surface trends and anomalies in your data using AI-driven analysis.
- Data Modeling Layer: Define relationships, hierarchies, and custom metrics directly within the platform.
- Embedded Analytics: Integrate search-driven analytics and visualizations into your own apps or portals.
ThoughtSpot Integrations
Integrations include GitHub, Google Sheets, Webhooks, and more.
Pros and Cons
Pros:
- Embedded analytics for custom app experiences
- Liveboard dashboards update with real-time data
- Natural language search for instant data queries
Cons:
- Exporting visualizations can be restrictive
- Data modeling options are less granular
Sigma brings spreadsheet-style analytics to the cloud, making it a strong fit for teams that rely on Excel but need enterprise-grade data access. It’s especially useful for business analysts and operations teams who want to work with live data using familiar spreadsheet formulas and logic. Unlike Looker, Sigma lets users analyze and visualize data directly from cloud data warehouses without writing SQL.
Why Sigma Is a Good Looker Alternative
For teams that want spreadsheet-style analytics in the cloud, Sigma offers a unique approach compared to Looker. I picked Sigma because it lets users interact with live data using familiar spreadsheet formulas and logic, without needing to write SQL. The platform’s visual data exploration and formula builder make it easy for business users to analyze large datasets directly from cloud data warehouses. If your team is comfortable with spreadsheets but needs scalable, governed analytics, Sigma bridges that gap in a way Looker doesn’t.
Sigma Key Features
Some other features in Sigma that are valuable for analytics teams include:
- Collaboration Tools: Multiple users can comment and work together on the same analysis in real time.
- Data Governance Controls: Admins can manage permissions and data access at a granular level.
- Embedded Analytics: Teams can embed dashboards and reports into external applications or portals.
- Audit Logs: Track user activity and changes for compliance and transparency.
Sigma Integrations
Integrations include Snowflake, Databricks, AWS, Azure, Google Cloud, and more.
Pros and Cons
Pros:
- Built-in audit logs for compliance tracking
- No SQL required for data exploration
- Direct connection to cloud data warehouses
Cons:
- No on-premises deployment option offered
- Limited advanced charting options available
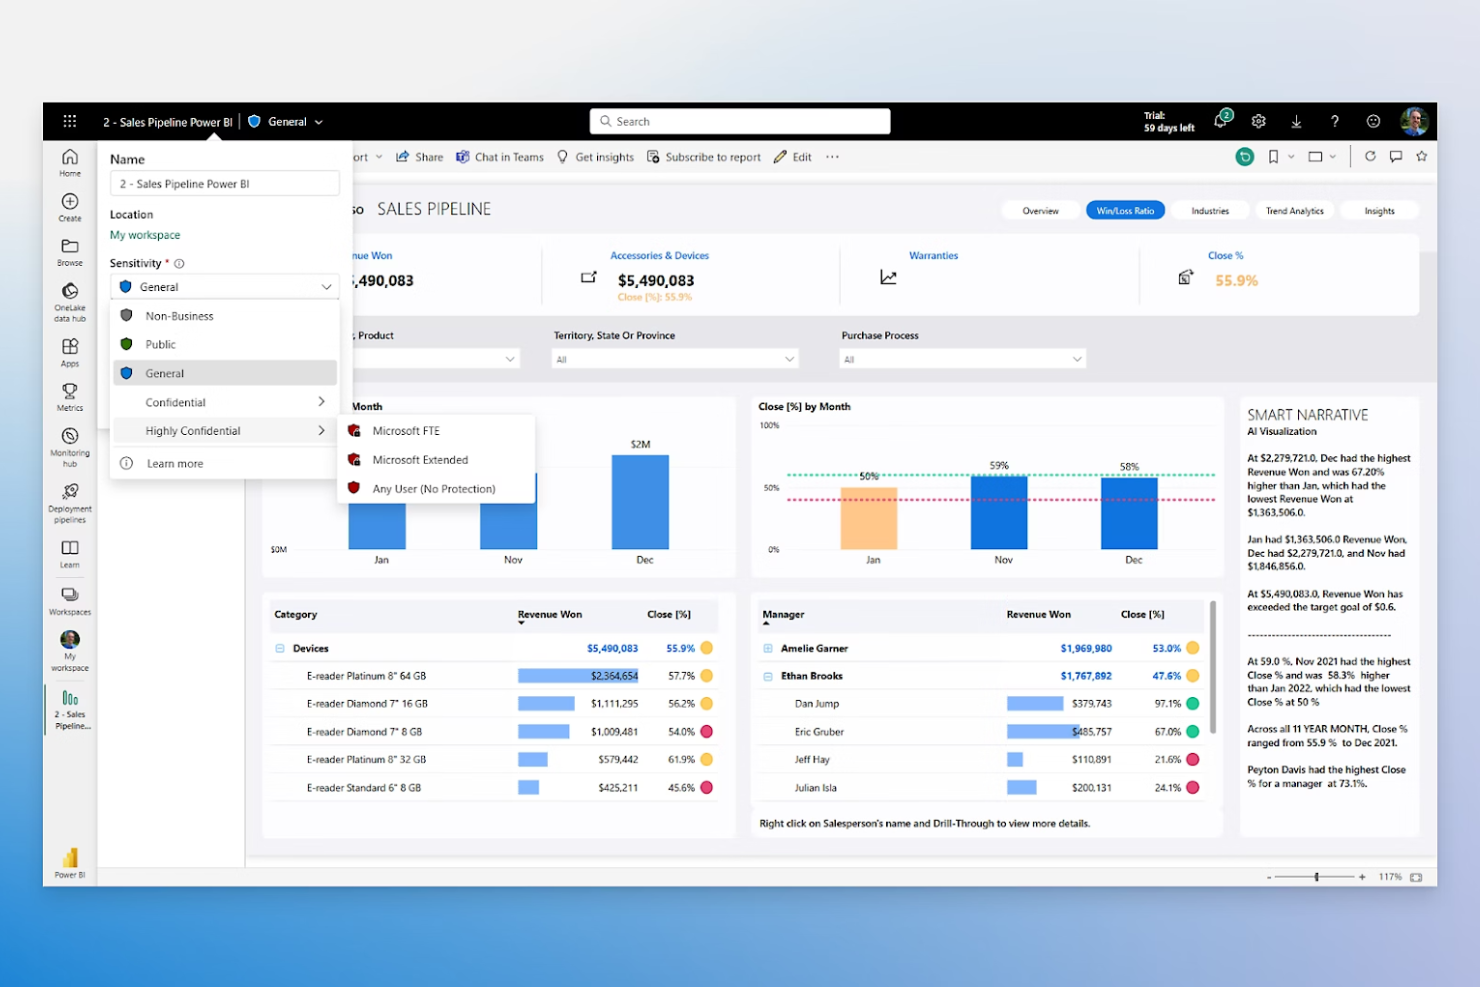
If your team relies on Microsoft 365, Power BI offers a natural fit for business intelligence and analytics. It’s especially useful for organizations that want to connect Excel, Teams, and SharePoint data directly into interactive dashboards. Power BI stands out for its deep integration with Microsoft’s ecosystem, making it easier to unify reporting and collaboration across familiar tools.
Why Power BI Is a Good Looker Alternative
For teams already invested in Microsoft 365, Power BI offers a level of integration that Looker can’t match. I picked Power BI because it lets you embed reports directly into Microsoft Teams and SharePoint, making analytics part of your daily workflow. Its ability to pull live data from Excel and other Microsoft apps simplifies reporting and collaboration. If your business depends on Microsoft’s productivity suite, Power BI brings analytics and business intelligence closer to where your team already works.
Power BI Key Features
Some other features in Power BI that are valuable for analytics teams include:
- AI-Powered Data Insights: Use built-in artificial intelligence to detect patterns and generate insights from your data.
- Custom Visual Marketplace: Access a library of custom visuals created by Microsoft and the Power BI community to improve your reports.
- Row-Level Security: Set granular permissions to control which users can view specific data within dashboards and reports.
- Scheduled Data Refresh: Automate data updates from connected sources to keep dashboards current without manual intervention.
Power BI Integrations
Integrations include Microsoft Excel, Microsoft Teams, SharePoint, Azure SQL Database, Databricks, and more.
Pros and Cons
Pros:
- Row-level security for granular data access
- Extensive library of custom visualizations
- Built-in AI features for automated insights
Cons:
- Data modeling less flexible than LookML
- Limited support for non-Microsoft data sources
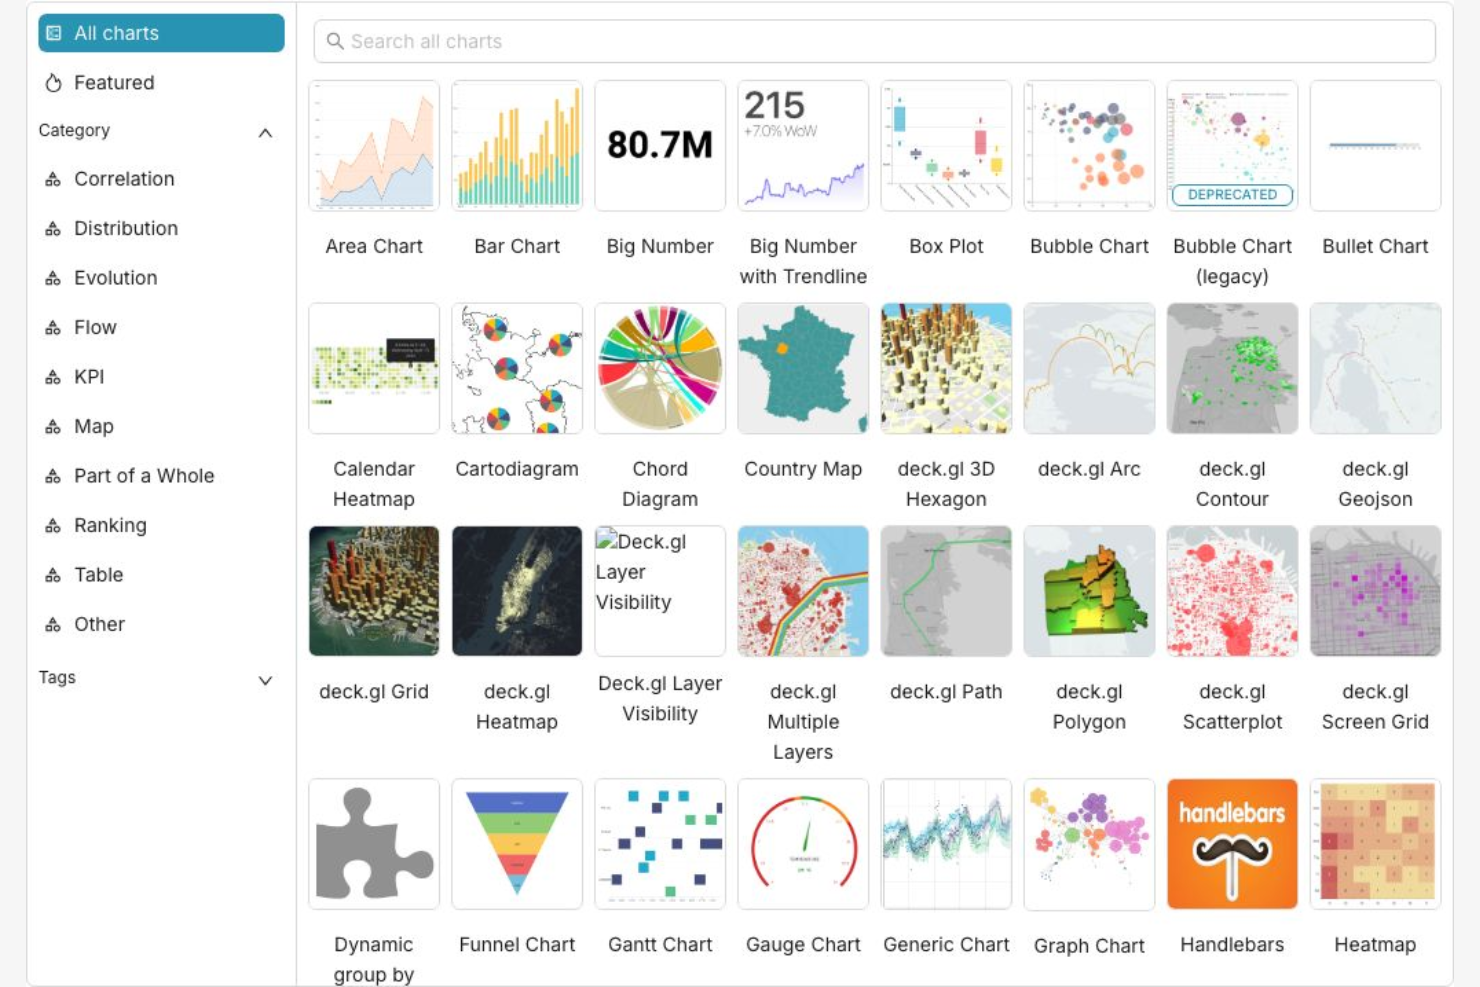
Open-source teams and organizations looking for deep dashboard customization often turn to Apache Superset. This platform appeals to data engineers and analysts who want full control over their analytics environment, from data connections to visualization design. Superset stands out for its flexible architecture, allowing you to tailor dashboards and workflows to fit unique business needs.
Why Apache Superset Is a Good Looker Alternative
If you want a business intelligence platform that you can fully customize, Apache Superset is worth considering as a Looker alternative. I picked Superset because it’s open-source, so you can modify the codebase and tailor dashboards to your exact requirements. The platform supports custom visualization plugins and lets you control every aspect of dashboard design and data connection. For teams that need flexibility and ownership over their analytics stack, Superset offers a level of customization that’s hard to match.
Apache Superset Key Features
Some other features in Apache Superset that are useful for analytics teams include:
- SQL Lab: Write, run, and save SQL queries directly within the platform.
- Role-Based Access Control: Manage user permissions and data access at a granular level.
- Extensive Chart Library: Choose from a wide range of built-in visualizations for your dashboards.
- Scheduled Reports: Automate the delivery of dashboard snapshots and reports to stakeholders.
Apache Superset Integrations
Native integrations are not currently listed.
Pros and Cons
Pros:
- Active community provides frequent feature updates
- No vendor lock-in for data storage
- SQL Lab enables direct query editing
Cons:
- Mobile dashboard experience is limited
- No official customer support channel
Otras alternativas a Looker
Aquí tienes algunas alternativas adicionales a Looker que no han llegado a mi lista corta, pero que igualmente vale la pena revisar:
- GoodData
For scalable multi-tenant analytics
- Zoho Analytics
For unified data blending across sources


Criterios de selección de alternativas a Looker
Al seleccionar las mejores alternativas a Looker para incluir en esta lista, consideré las necesidades comunes de los compradores y los puntos críticos habituales con productos de Plataformas de Inteligencia Empresarial y Análisis de Datos, como habilitar el análisis de datos por parte de usuarios no técnicos y admitir la exploración de datos en tiempo real. También utilicé el siguiente marco para que mi evaluación fuera estructurada y justa:
Funcionalidad principal (25% de la puntuación total)
Para ser consideradas en esta lista, cada solución debía responder a estos casos de uso comunes:
- Crear paneles y reportes interactivos
- Conectar con múltiples fuentes de datos
- Visualizar datos con gráficos y diagramas
- Programar y automatizar la entrega de informes
- Compartir conocimientos con miembros del equipo
Características destacadas adicionales (25% de la puntuación total)
Para ayudar a reducir aún más la competencia, también busqué características únicas, tales como:
- Capacidades de consulta en lenguaje natural
- Analítica integrada para aplicaciones externas
- Controles avanzados de gobernanza de datos
- Colaboración en tiempo real en informes
- Información de datos impulsada por IA
Facilidad de uso (10% del puntaje total)
Para evaluar la facilidad de uso de cada sistema, consideré lo siguiente:
- Navegación intuitiva y estructura de menús
- Diseño de interfaz limpio y moderno
- Mínimos clics para completar tareas comunes
- Diseños de panel personalizables
- Rendimiento ágil con grandes volúmenes de datos
Incorporación (10% del puntaje total)
Para evaluar la experiencia de incorporación de cada plataforma, consideré lo siguiente:
- Disponibilidad de recorridos guiados paso a paso
- Acceso a videos de formación y documentación
- Plantillas predefinidas de paneles e informes
- Chatbots dentro de la aplicación para soporte en la incorporación
- Webinars de incorporación en vivo o grabados
Atención al Cliente (10% del puntaje total)
Para evaluar los servicios de atención al cliente de cada proveedor de software, consideré lo siguiente:
- Múltiples canales de soporte disponibles
- Tiempos de respuesta rápidos ante consultas
- Acceso a una base de conocimientos con búsqueda
- Disponibilidad de gestores dedicados de éxito del cliente
- Foros de comunidad para soporte entre pares
Relación Calidad-Precio (10% del puntaje total)
Para evaluar la relación calidad-precio de cada plataforma, consideré lo siguiente:
- Planes de precios transparentes y flexibles
- Funcionalidades incluidas en cada nivel de precio
- Disponibilidad de prueba gratuita o demo
- Sin cargos ocultos ni costes sorpresa
- Descuentos por compromisos anuales o por volumen
Opiniones de Clientes (10% del puntaje total)
Para obtener una idea de la satisfacción general del cliente, tuve en cuenta lo siguiente al leer las reseñas de los usuarios:
- Comentarios positivos sobre la facilidad de uso
- Informes de funcionamiento fiable
- Satisfacción con el soporte al cliente
- Valor percibido por el precio pagado
- Frecuencia de mejoras y actualizaciones de funcionalidad
¿Por Qué Buscar Una Alternativa a Looker?
Si bien Looker es una buena opción como Plataforma de Inteligencia de Negocio y Analítica de Datos, hay varias razones por las que algunos usuarios buscan soluciones alternativas. Es posible que busques una alternativa a Looker porque…
- Deseas una herramienta que no requiera conocimientos de SQL
- Necesitas precios más flexibles o transparentes
- Prefieres una interfaz de análisis al estilo hoja de cálculo
- Requieres controles más avanzados de gobernanza de datos
- Necesitas una configuración y proceso de incorporación más rápidos para nuevos usuarios
- Quieres integraciones nativas con almacenes de datos en la nube específicos
Si cualquiera de estos puntos se ajusta a tu situación, llegaste al lugar correcto. Mi lista contiene varias opciones de Plataformas de Inteligencia de Negocio y Analítica de Datos que resultan más adecuadas para equipos que se enfrentan a estos desafíos con Looker y buscan alternativas.
Funciones Clave de Looker
A continuación se presentan algunas de las principales características de Looker, para ayudarte a comparar y contrastar lo que ofrecen las soluciones alternativas:
- Modelado de datos con el lenguaje LookML
- Paneles y visualizaciones personalizables
- Analítica integrada para aplicaciones externas
- Entrega de informes programada y automatizada
- Integración con los principales almacenes de datos en la nube
- Controles y permisos de acceso basados en roles
- Exploración y consulta de datos en tiempo real
- Acceso por API para integraciones personalizadas
- Control de versiones para contenido analítico
- Herramientas de colaboración para compartir hallazgos