

Et godt alternativ til Databox gir teamet ditt flere måter å koble sammen data på, automatisere inntektsrapporter og tilpasse nøkkeltall for hver forretningsenhet. Når du ønsker analyseverktøy som samler inntektsoversikter, skalerer KPI-modellering, automatiserer dashbord på tvers av team og passer inn i komplekse stakker for salg og markedsføring, lønner det seg å se lenger enn det grunnleggende.
I denne veiledningen fremhever jeg de beste alternativene til Databox for 2026, med fokus på produkter som hjelper RevOps-ledere med å synkronisere data fra salg, markedsføring og kundesuksess – slik at du kan skape tillit til hvert eneste tall og gi teamene dine klarheten de trenger for å nå ambisiøse mål.
Hva er Databox?
Databox er en plattform for forretningsanalyse som kobler sammen data fra flere kilder for å opprette enhetlige dashbord i sanntid for inntektsdrift samt salgs- og markedsføringsteam. Du kan hente inn nøkkeltall fra CRM-systemet, annonseplattformer og tilpassede databaser for å automatisere rapporteringen og holde ledelsen informert. Databox hjelper team med å følge med på inntektsresultater, overvåke KPI-er og støtte samordning på tvers av markedsstrategien – uten koding eller komplisert oppsett.
Hvorfor du kan stole på våre programvareanbefalinger
6,700+
Reviews
20
Industry experts
16+
Evaluation factors
14
Years
Anmeldelsene våre bygger på vår uavhengige vurdering, ikke på salgsargumenter. Les hvordan vi sørger for åpenhet.
I denne guiden har vi vurdert verktøyene gjennom praktisk testing og uavhengig research og gitt dem poeng ut fra våre utvelgelseskriterier.
Anmeldelsene våre bygger på vår egen redaksjonelle vurdering. De er ikke et salgsargument.
Sammenligningstabell: Alternativer til Databox
Sammenlign priser og spesifikasjoner side om side for alternativene til Databox som kom med på kortlisten min.
| Tool | Best For | Trial Info | Price | ||
|---|---|---|---|---|---|
| 1 | Best for Salesforce-stack revenue analytics at scale | 14-day free trial | Pricing upon request | Website | |
| 2 | Best for 1,000+ source marketing data pipelines | Free plan + free demo available | From $100/month | Website | |
| 3 | Best for AI-driven KPI tracking at enterprise scale | 30-day free trial | Pricing upon request | Website | |
| 4 | Best for agencies reporting across 250+ ad sources | Free demo + 14-day free trial | Pricing upon request | Website | |
| 5 | Best for ETL-backed dashboards with BYO warehouse | Free trial + free demo available | From $265/month (billed annually) | Website | |
| 6 | Best for governed metrics from a data warehouse | 14-day free trial | From $120/month (billed annually) | Website | |
| 7 | Best for white-label automated agency reporting | Free demo + 14-day free trial | From $20/client/month (billed annually) | Website | |
| 8 | Best for white-label marketing report delivery | Free demo available | From $812/month (billed annually) | Website | |
| 9 | Best for governed metric modeling at enterprise scale | Free trial + free demo available | Pricing upon request | Website | |
| 10 | Best for DAX-modeled revenue metrics in Microsoft 365 | Free plan available | From $14/user/month (billed annually) | Website |


Anmeldelser av de beste alternativene til Databox
Nedenfor finner du mine detaljerte sammendrag av de beste alternativene til Databox som kom med på kortlisten min. Anmeldelsene mine gir et detaljert innblikk i funksjonene, integrasjonene og de beste bruksområdene for hver plattform, slik at du kan finne den som passer best for deg.
 Best for Salesforce-stack revenue analytics at scale
- 14-day free trial
- Pricing upon request
Visit WebsiteCustomer Rating:4.5/5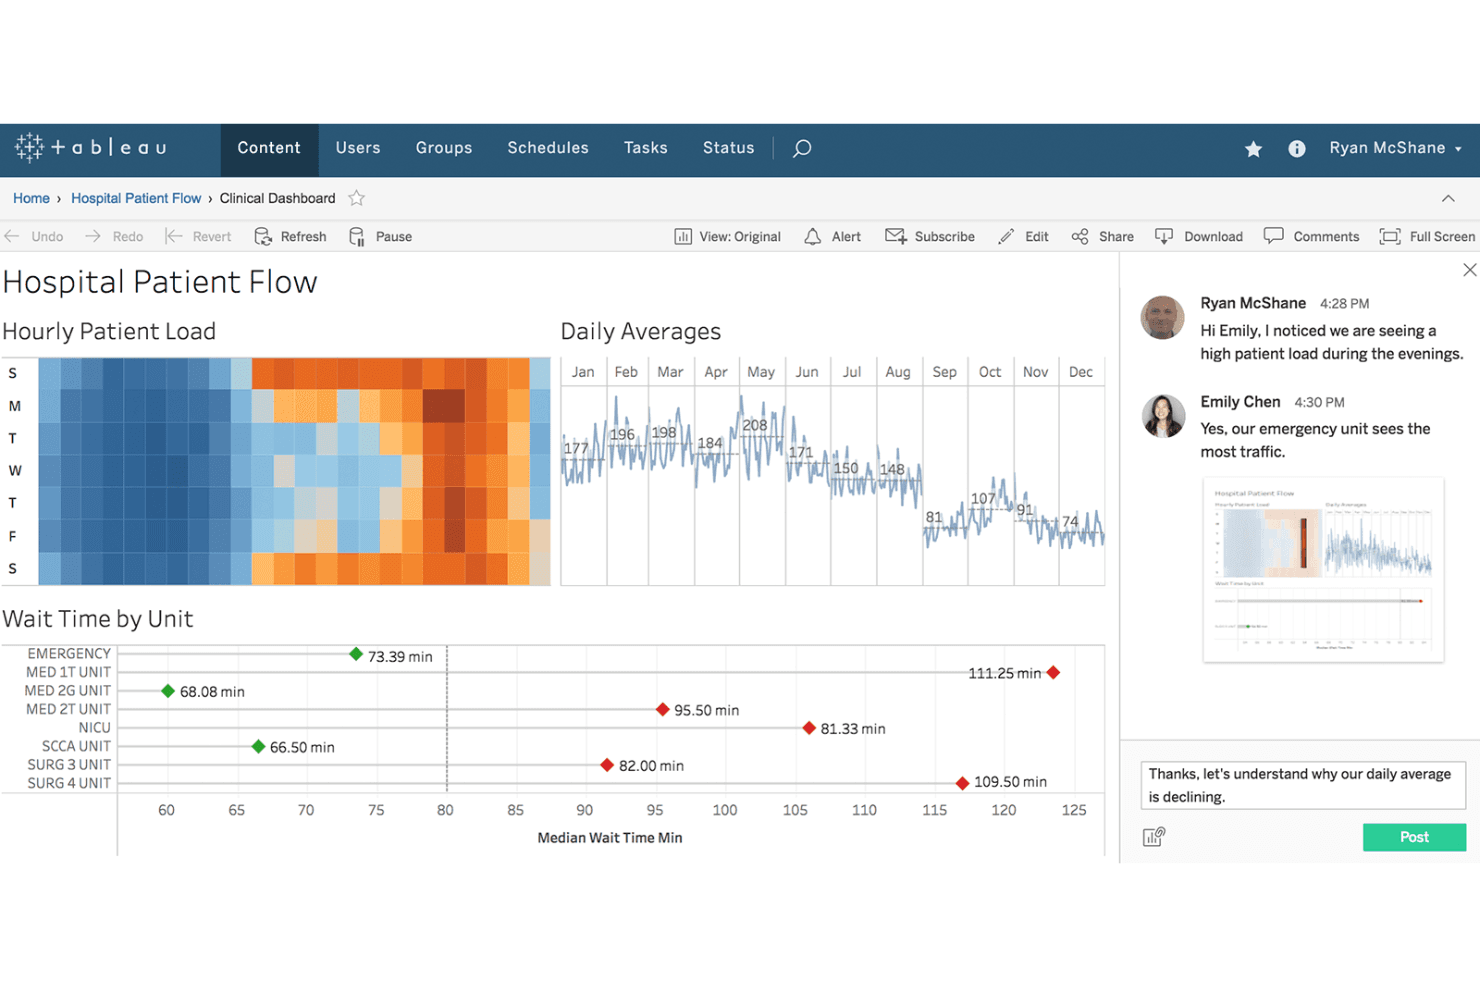
Tableau enables real-time collaboration on dashboards. Tableau is an advanced analytics platform designed for data-driven teams who need rich visualizations, customizable dashboards, and actionable business insights from their revenue tech stack data.
Who Is Tableau Best For?
Tableau is a strong fit for revenue operations teams at large enterprises that need actionable analytics across the entire Salesforce stack.
Why Tableau Is a Good Databox Alternative
I picked Tableau as one of the best databox alternatives because it excels at handling large-scale, Salesforce-stack revenue analytics. I use Tableau to create interactive dashboards that span CRM, forecasting, and sales pipeline metrics. I rely on its deep Salesforce integration and advanced visualization tools to surface revenue trends across distributed teams.
Tableau Key Features
- Data blending: Combine data from multiple sources to create unified visualizations.
- Calculated fields: Create custom metrics directly within dashboards using formulas and expressions.
- Scheduled data refresh: Automate updates to your dashboards with configurable data refresh schedules.
- Role-based permissions: Control data and dashboard access for users by assigning detailed permissions.
Tableau Integrations
Tableau offers native integrations with Salesforce, Google BigQuery, Amazon Redshift, Microsoft SQL Server, Snowflake, Oracle, Google Analytics, Microsoft Excel, SAP, and Dropbox. An API is available for custom integrations.
Pros and Cons
Pros:
- Flexible calculated fields for custom KPIs
- Handles complex, multi-source data blending
- Deep Salesforce reporting and visualization options
Cons:
- Dashboard performance drops with very large datasets
- Initial setup is time-intensive
Learn more about Tableau: Best for 1,000+ source marketing data pipelines
- Free plan + free demo available
- From $100/month
Visit WebsiteCustomer Rating:4.5/5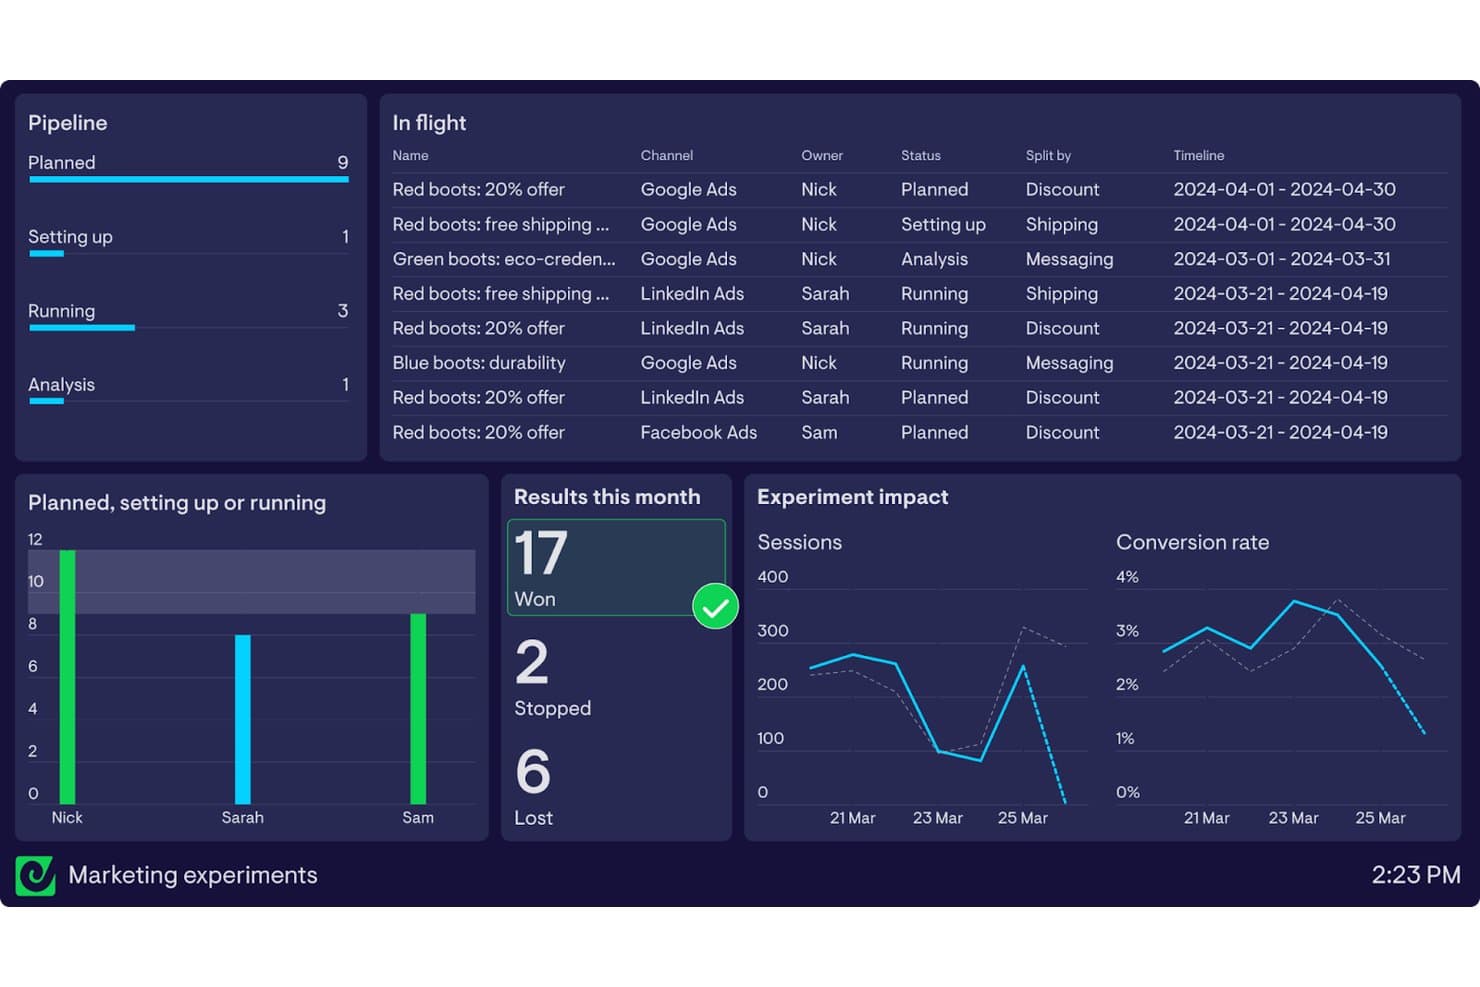
Improvado tracks marketing experiment results across channels and owners. Improvado is a data pipeline platform built for marketing, sales, and revenue operations teams that need to centralize complex, large-scale reporting across hundreds of data sources without DIY data engineering.
Who Is Improvado Best For?
Improvado is a solid choice for marketing and revenue operations teams at large enterprises managing complex multi-channel data pipelines.
Why Improvado Is a Good Databox Alternative
I picked Improvado as a Databox alternative because it handles complex, large-scale marketing data pipelines across more than 1,000 sources. My team relies on its automated data extraction and centralized reporting to keep every channel and campaign in sync without juggling separate platforms or custom connectors.
Improvado Key Features
- Custom data transformation: Edit and normalize incoming data streams using a no-code visual interface.
- Automated data mapping: Automatically map and match fields from different sources into unified datasets.
- Advanced data visualization connectors: Connect directly to BI and dashboard tools, including Tableau, Looker, and Power BI.
- Role-based access control: Set granular permissions for users and teams to manage data access securely.
Improvado Integrations
Improvado offers 500+ native integrations with marketing, analytics, and ad platforms, including Google Ads, Facebook Ads, Google Analytics, Salesforce, HubSpot, LinkedIn Ads, Amazon Advertising, Mailchimp, TikTok Ads, and Shopify. An API is available for custom integrations.
Pros and Cons
Pros:
- Automated data normalization across multiple channels
- No-code data transformation for custom reporting
- Handles over 1,000 marketing data sources
Cons:
- Requires support for advanced custom metrics
- Initial setup process can be time-intensive
Learn more about Improvado: 3Best for AI-driven KPI tracking at enterprise scale
Domo
- 30-day free trial
- Pricing upon request
Visit WebsiteCustomer Rating:4.4/5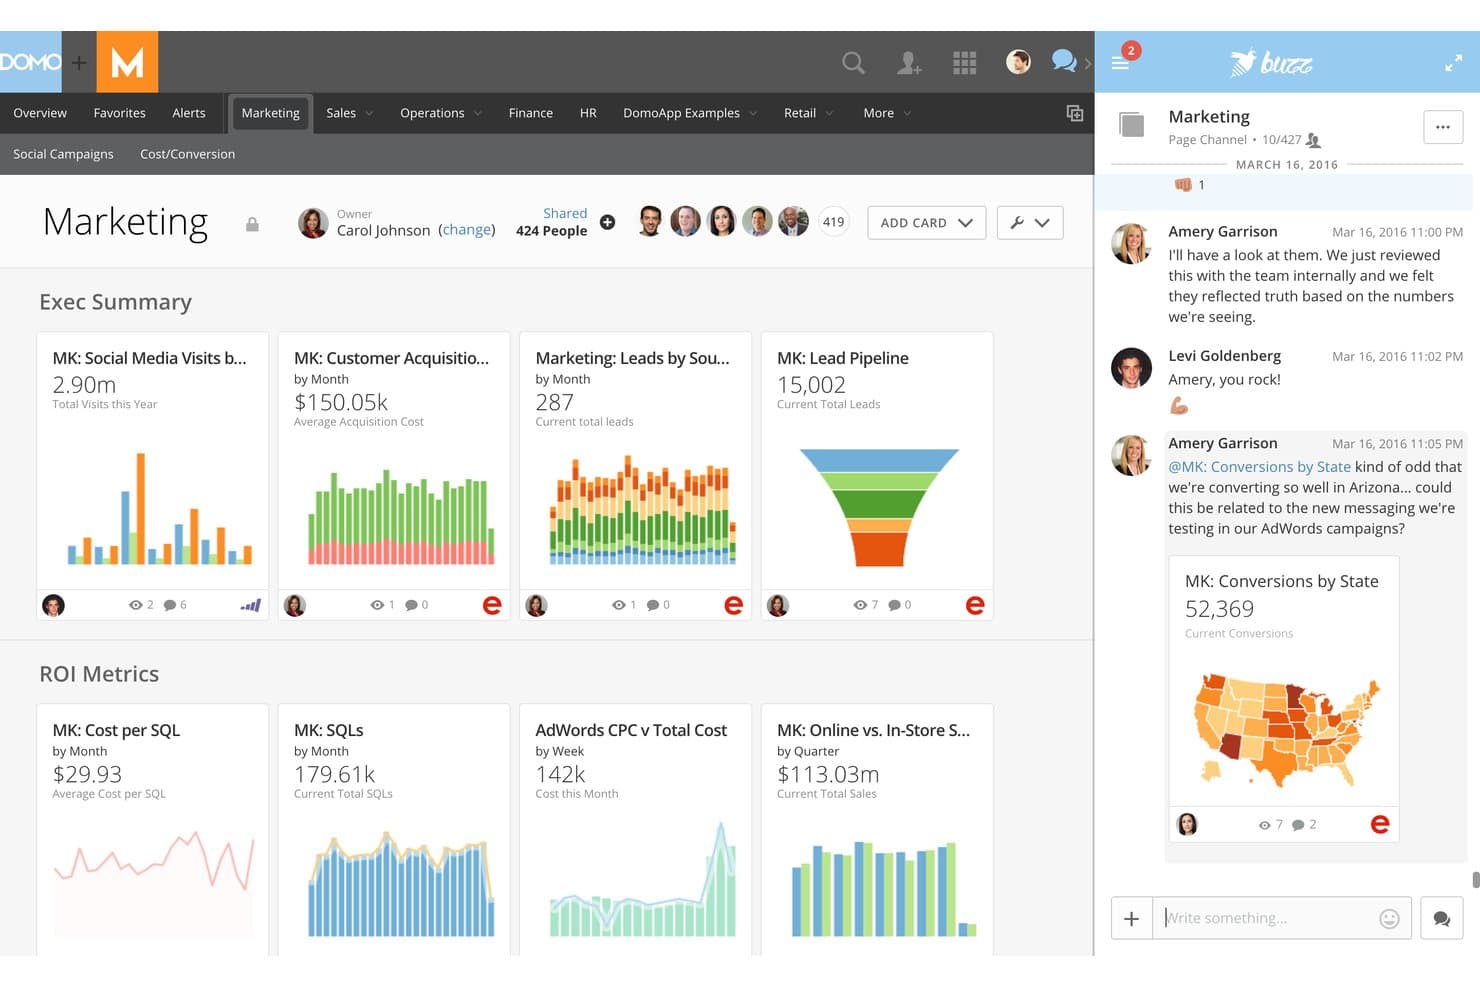
Domo centralizes marketing analytics and team collaboration in one dashboard. Domo is an enterprise data experience platform for revenue, operations, and analytics teams that need to unify KPI tracking, dashboards, and data workflows across departments and business units.
Who Is Domo Best For?
Domo is a strong fit for large enterprises that need to connect, analyze, and visualize data across multiple business units and teams.
Why Domo Is a Good Databox Alternative
I picked Domo as a top alternative because its AI-driven KPI tracking excels when my team needs to analyze metrics across large, multi-department orgs. I use Domo to bring together data from sales, marketing, and customer success for dynamic, customizable dashboards. Its AI capabilities help me surface actionable trends and automate cross-team insights at scale.
Domo Key Features
- Data connectors library: Access hundreds of pre-built connectors to unify data from cloud apps, databases, and spreadsheets.
- Magic ETL workflows: Build custom data pipelines with a visual editor for blending, cleaning, and transforming data.
- Custom app creation: Develop and deploy tailored data apps directly in Domo to solve unique business needs.
- Embedded analytics: Embed interactive dashboards and visualizations in portals or apps to share insights with stakeholders.
Domo Integrations
Domo offers hundreds of native integrations with tools like Salesforce, Google Analytics, Google Sheets, HubSpot, Microsoft 365, Snowflake, Amazon Redshift, MySQL, Box, Jira, and Slack. An API is available for custom integrations.
Pros and Cons
Pros:
- Visual data pipelines reduce manual transformation work
- Custom app builder for department-specific dashboards
- AI highlights trends across multiple business units
Cons:
- Performance slows with extremely large datasets
- Can overwhelm small teams with feature scope
Learn more about Domo: Best for agencies reporting across 250+ ad sources
- Free demo + 14-day free trial
- Pricing upon request
Visit WebsiteCustomer Rating:4.3/5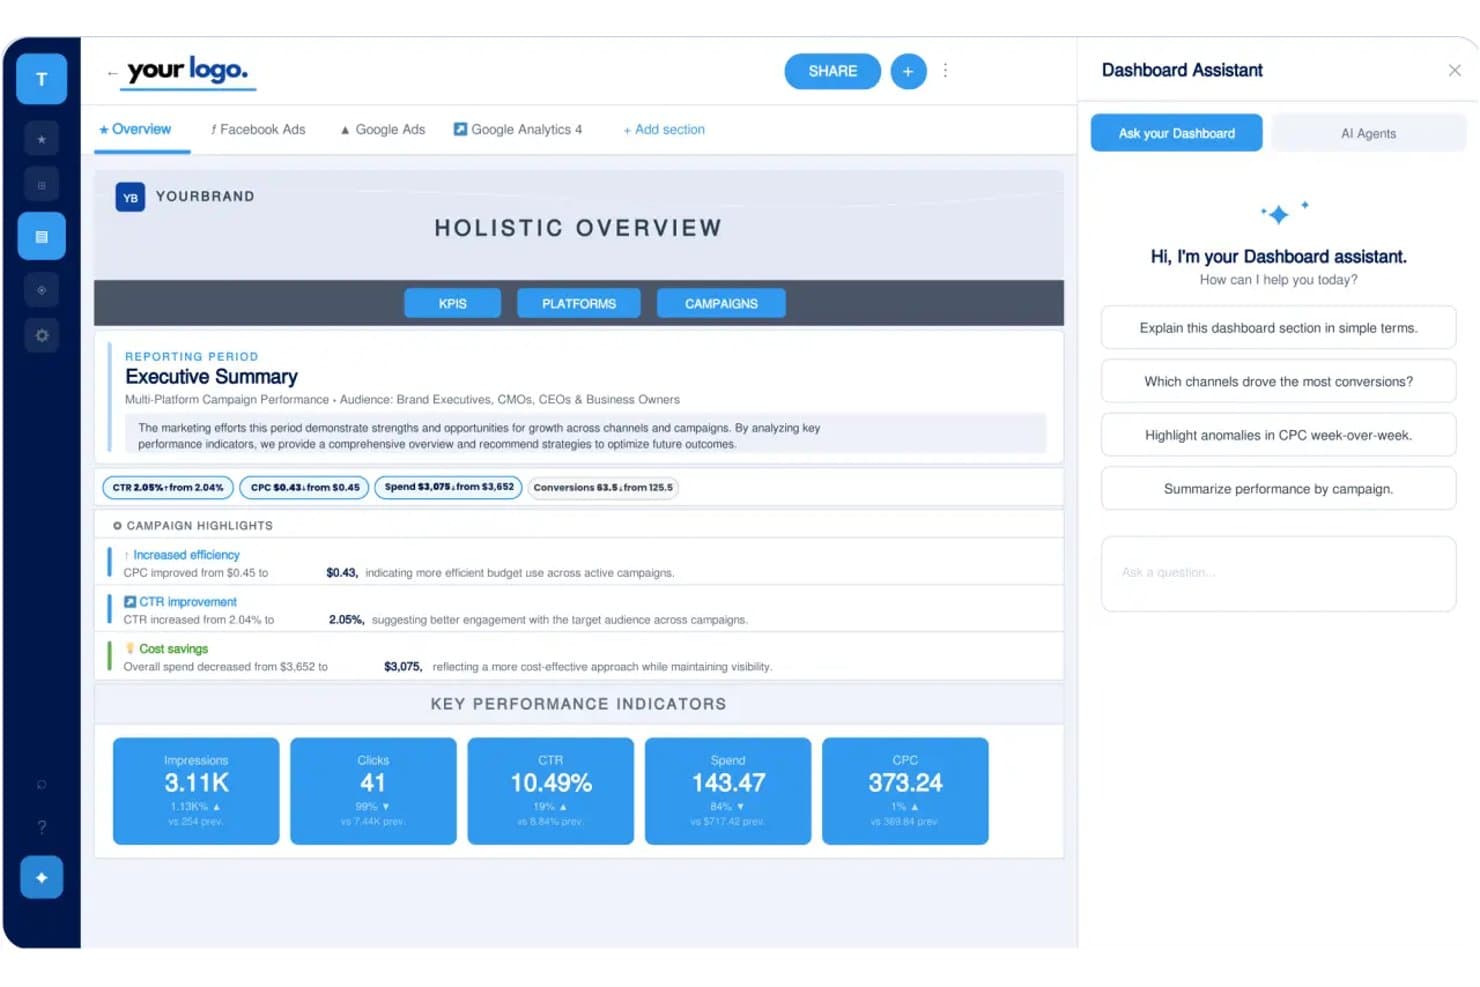
TapClicks centralizes multi-platform campaign KPIs in one dashboard. TapClicks brings marketing analytics and reporting together in one dashboard, making it a strong option for agencies and teams that need detailed cross-channel campaign insights, unified data management, and simplified client reporting across a broad range of ad platforms.
Who Is TapClicks Best For?
Agencies and marketing teams who need to consolidate analytics and automate reporting across a wide range of digital ad channels.
Why TapClicks Is a Good Databox Alternative
I picked TapClicks as a top alternative because I can unify analytics from over 250 ad sources in a single dashboard, automate complex cross-channel reporting for large client portfolios, and manage campaign data with customizable widgets that fit each client’s needs. This makes TapClicks ideal when robust data aggregation is a must.
TapClicks Key Features
- Scheduled data exports: Automatically deliver campaign data reports to client inboxes on a set schedule.
- Role-based access controls: Assign permissions to different users so each person sees only the dashboards and data relevant to them.
- White-label portal branding: Customize client-facing dashboards and reports with your agency’s branding and logo.
- Drag-and-drop dashboard builder: Easily create and arrange visual widgets to build custom dashboards for different clients.
TapClicks Integrations
TapClicks offers native integrations with more than 250 data sources, including Google Ads, Facebook Ads, LinkedIn Ads, Twitter Ads, HubSpot, Salesforce, Mailchimp, Google Analytics, Adobe Analytics, and CallRail. An API is available for custom integrations.
Pros and Cons
Pros:
- Automates recurring cross-channel client reports
- Customizes dashboards with drag-and-drop builder
- Consolidates analytics from over 250 ad sources
Cons:
- Delays in syncing large data volumes
- Interface can feel overwhelming for new users
Learn more about TapClicks: Best for ETL-backed dashboards with BYO warehouse
- Free trial + free demo available
- From $265/month (billed annually)
Visit WebsiteCustomer Rating:4.4/5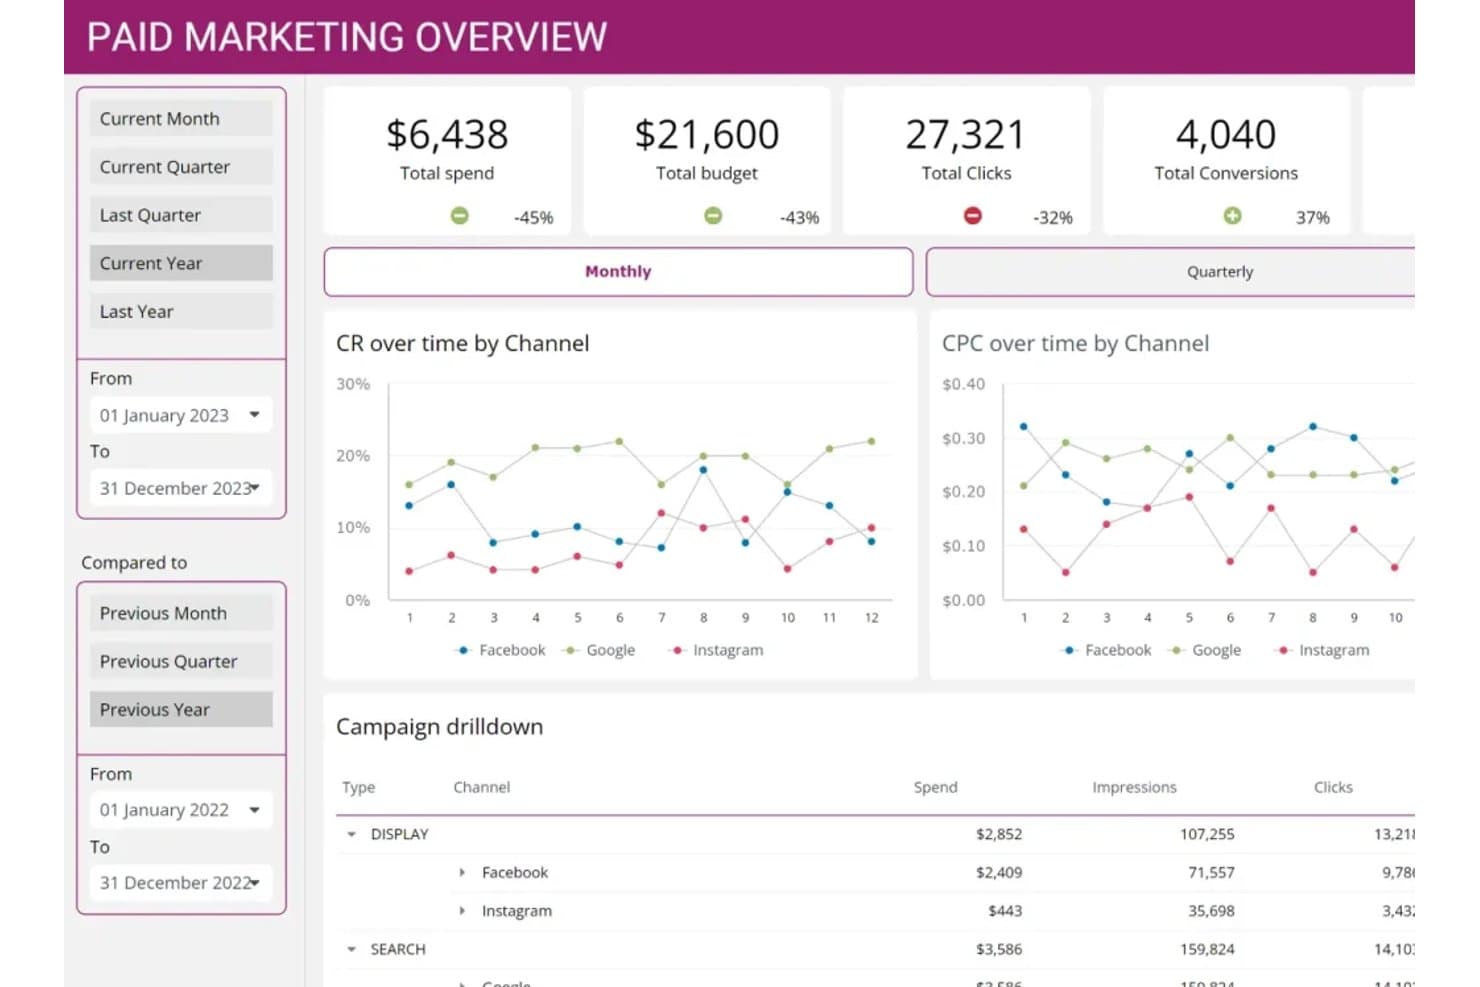
ClicData tracks paid marketing spend, clicks, and conversions across channels. ClicData gives revenue operations teams and data analysts an all-in-one business intelligence platform for connecting multiple data sources, transforming data, and building custom dashboards for real-time reporting and analysis.
Who Is ClicData Best For?
ClicData is a smart choice for revenue operations teams and analysts who need to connect, transform, and visualize data from multiple business sources.
Why ClicData Is a Good Databox Alternative
I picked ClicData because it lets me connect data from anywhere, run ETL processes, and build dashboards directly on top of my own warehouse. I like that I can manage data transformations and automations inside the platform, then push clean, real-time metrics to custom reports for my team.
ClicData Key Features
- Scheduled data refreshes: Automatically update your dashboards with the latest data on a custom schedule.
- Access controls: Set granular permissions for each team member or audience who views data or dashboards.
- Collaboration tools: Share interactive dashboards and reports with internal and external stakeholders directly from the platform.
- Prebuilt connector library: Connect quickly to a wide range of cloud apps, databases, and files without manual setup.
ClicData Integrations
ClicData offers native integrations with Google Analytics, Salesforce, HubSpot, MySQL, Microsoft SQL Server, Amazon Redshift, Dropbox, Google Drive, OneDrive, and Facebook Ads. An API is available for custom integrations.
Pros and Cons
Pros:
- Schedule data refreshes for live dashboards
- Data transformations managed inside the platform
- ETL tools built in for custom data prep
Cons:
- Dashboard interface can feel dated
- Requires setup for complex data sources
Learn more about ClicData: Best for governed metrics from a data warehouse
- 14-day free trial
- From $120/month (billed annually)
Visit WebsiteCustomer Rating:4.7/5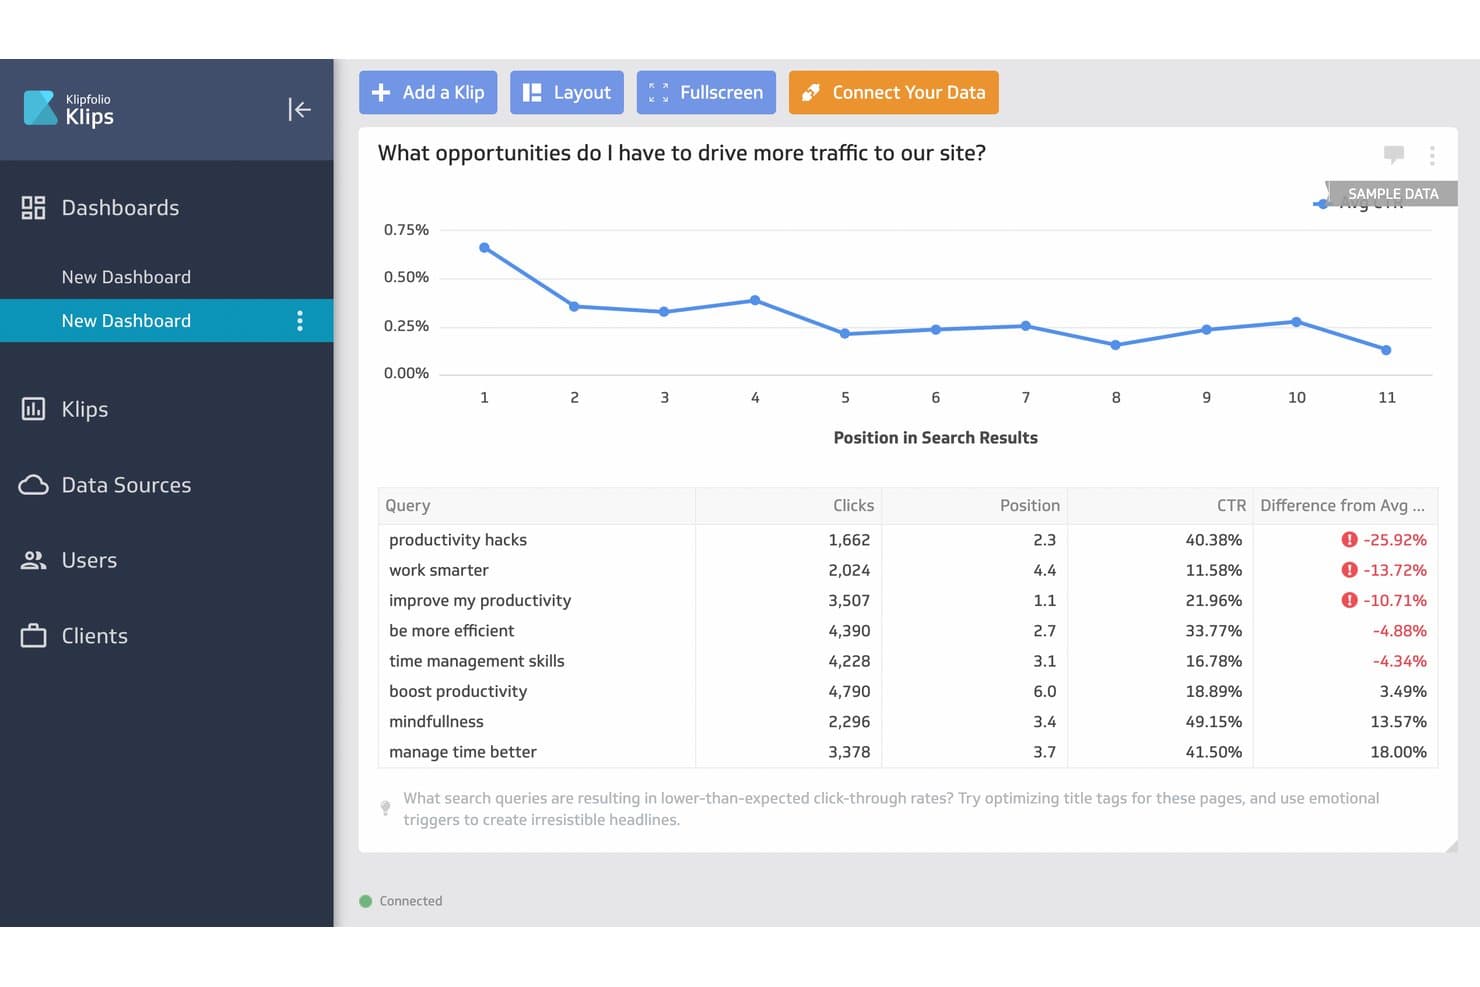
Klipfolio surfaces low-CTR search queries to uncover traffic growth opportunities. Klipfolio helps revenue teams connect, monitor, and visualize data from multiple sources, making it easier to govern reporting and maintain analytics consistency across sales, marketing, and customer success functions.
Who Is Klipfolio Best For?
Revenue operations teams at mid-sized and large companies who need consistent, governed metrics from diverse data warehouse sources.
Why Klipfolio Is a Good Databox Alternative
I picked Klipfolio as a top alternative because it gives my team strong control over metric governance across data warehouse sources. I like how I can enforce consistent definitions for sales, marketing, and customer success reporting, plus connect and visualize multiple live data feeds confidently in a single place.
Klipfolio Key Features
- Custom dashboard builder: Drag and drop widgets to create dashboards tailored to specific KPIs and audience needs.
- Real-time data refresh: Schedule automatic data updates to ensure dashboards always show the latest metrics.
- Pre-built visualizations: Choose from a variety of chart types, tables, and graphs to present data clearly.
- Data source connectors: Connect to popular databases, cloud apps, and spreadsheets without manual data imports.
Klipfolio Integrations
Klipfolio offers native integrations with Google Analytics, Salesforce, HubSpot, Google Sheets, SQL databases, Microsoft Excel, Facebook Ads, Intercom, Stripe, and Shopify. An API is available for custom integrations.
Pros and Cons
Pros:
- Custom dashboards for cross-department KPI views
- Connects directly to enterprise data warehouses
- Enforces strict metric definitions across teams
Cons:
- Less suited for rapid ad hoc reporting
- Advanced governance features require steep setup effort
Learn more about Klipfolio: Best for white-label automated agency reporting
- Free demo + 14-day free trial
- From $20/client/month (billed annually)
Visit WebsiteCustomer Rating:4.7/5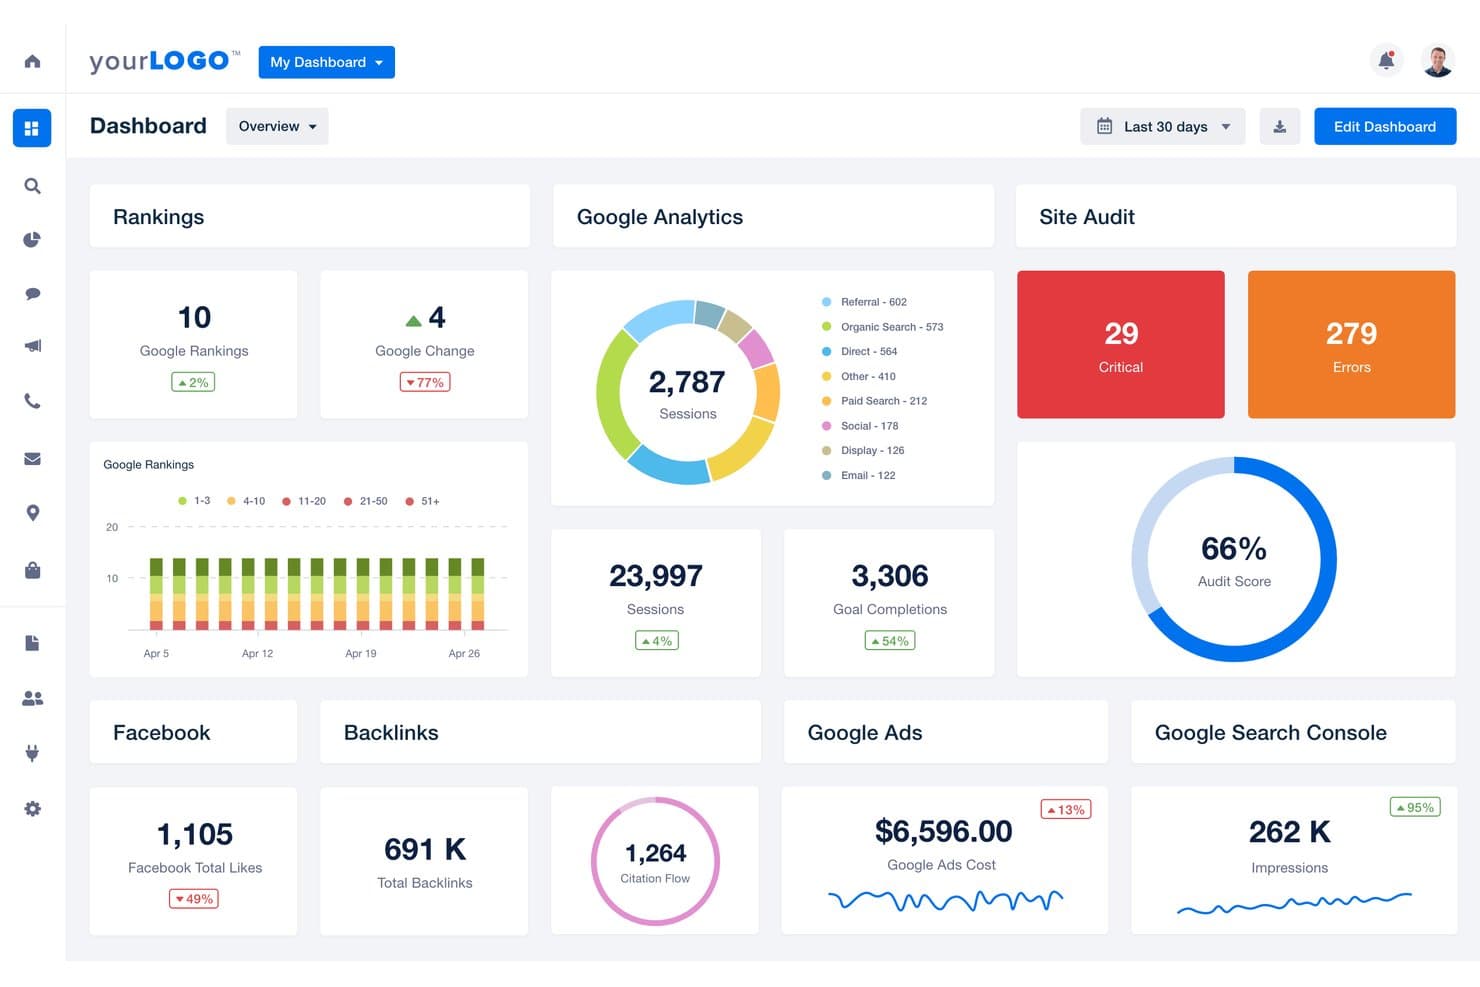
AgencyAnalytics unifies SEO, ads, and social metrics in one dashboard. AgencyAnalytics is a reporting and analytics platform designed for digital agencies, bringing together marketing data from dozens of channels to help you track campaigns, monitor SEO, and deliver clear, visual reports to clients and stakeholders.
Who Is AgencyAnalytics Best For?
Digital agencies that need to deliver automated, white-label marketing and SEO reports to clients.
Why AgencyAnalytics Is a Good Databox Alternative
I picked AgencyAnalytics as a top Databox alternative because I can deliver automated, fully white-labeled reports for clients without extra manual work. My team uses its pre-built integrations and custom dashboards to pull marketing and SEO data from multiple sources into branded, client-ready reports. This saves hours every month on repetitive reporting tasks.
AgencyAnalytics Key Features
- Drag-and-drop dashboard builder: Quickly assemble custom dashboards by dragging and dropping widgets for different marketing channels.
- Automated report scheduling: Set up reports to be sent to clients or stakeholders on a recurring schedule without manual intervention.
- Custom metric creation: Define and track unique KPIs and metrics tailored to your agency's specific needs.
- Goal tracking and annotations: Monitor campaign progress against defined goals and add context with annotations directly on charts and reports.
AgencyAnalytics Integrations
AgencyAnalytics offers over 70 native integrations, including Google Analytics, Google Ads, Facebook Ads, Facebook Insights, LinkedIn Ads, HubSpot, Mailchimp, SEMrush, Ahrefs, Moz, and Shopify. An API is available for custom integrations.
Pros and Cons
Pros:
- Drag-and-drop dashboard builder is highly flexible
- Pre-built dashboards for marketing and SEO data
- Automated white-label report scheduling for clients
Cons:
- Collaboration features limited compared to some platforms
- Custom data source setup can be time-consuming
Learn more about AgencyAnalytics: Best for white-label marketing report delivery
- Free demo available
- From $812/month (billed annually)
Visit WebsiteCustomer Rating:4.5/5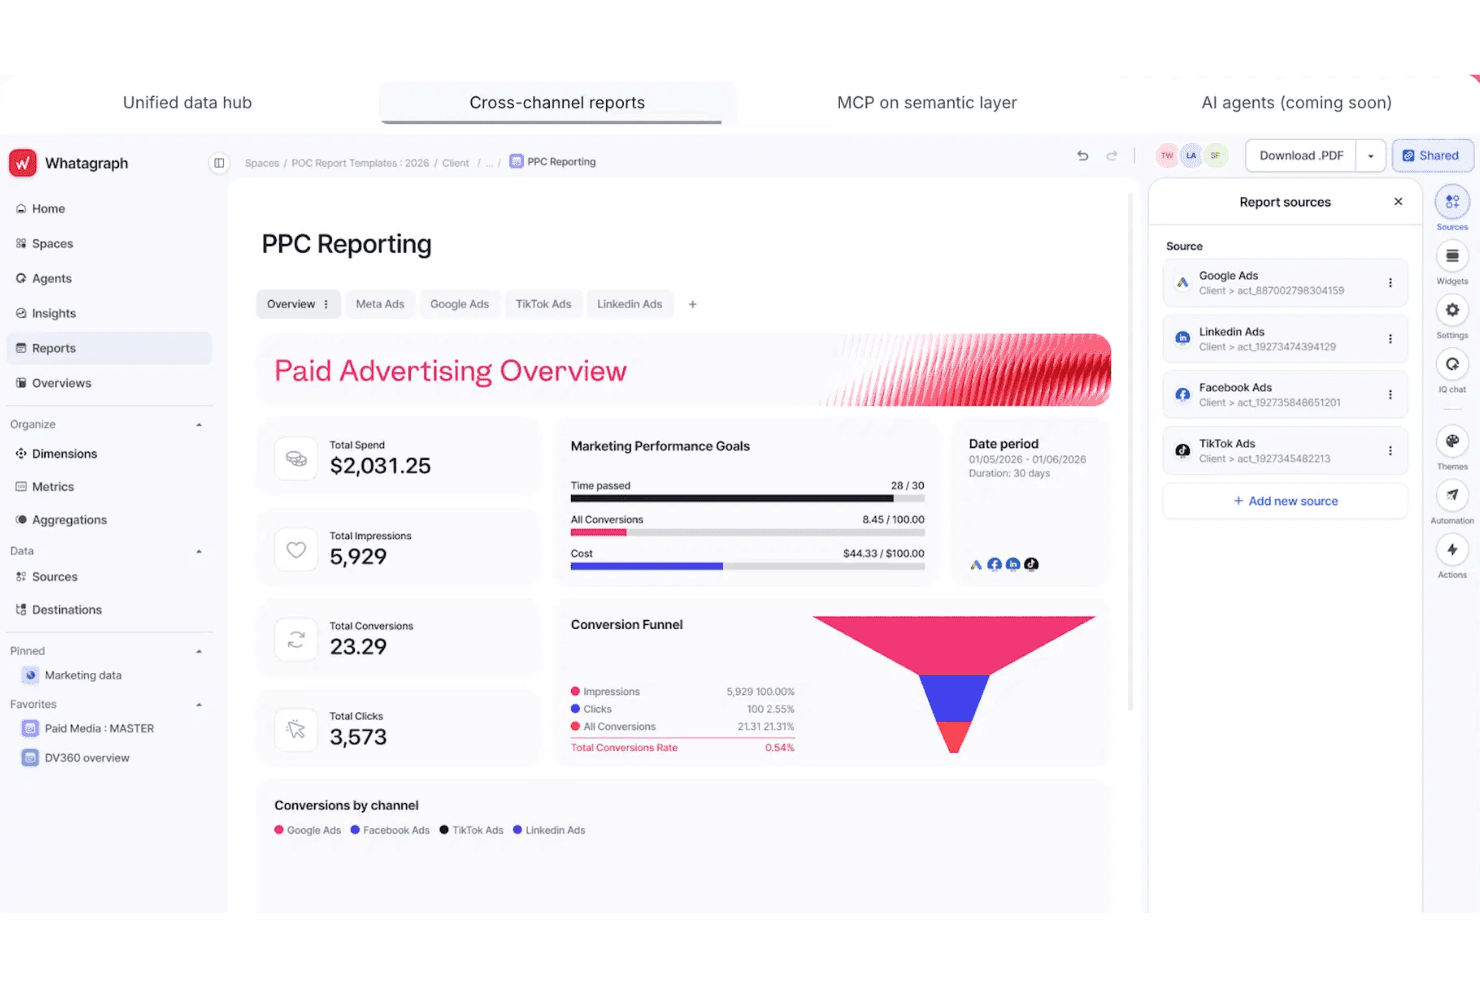
Whatagraph unifies PPC data across channels in one report. Whatagraph gives marketing teams and agencies a way to collect, visualize, and deliver cross-channel performance data in a single platform for easier campaign reporting and client communication.
Who Is Whatagraph Best For?
Agencies and marketing teams that need to deliver customized, white-label performance reports across multiple marketing channels.
Why Whatagraph Is a Good Databox Alternative
I picked Whatagraph because I can design and deliver white-label marketing reports with cross-channel data, custom branding, and scheduled client delivery. My team uses its drag-and-drop editor to build tailored dashboards for each client and automate recurring performance summaries that match our agency’s visual identity.
Whatagraph Key Features
- Pre-built report templates: Choose from a library of marketing, PPC, and social media templates to accelerate report creation.
- Live data widgets: Add dynamic data widgets that update automatically from connected sources.
- Custom data source integrations: Connect to a wide range of third-party tools and platforms via native integrations or API.
- Team collaboration tools: Invite users, assign roles, and manage workflows to create reports together in one platform.
Whatagraph Integrations
Whatagraph offers native integrations with Google Analytics, Facebook Ads, Google Ads, LinkedIn Ads, HubSpot, Mailchimp, Shopify, Instagram, YouTube, and Google Sheets, with an API available for custom integrations.
Pros and Cons
Pros:
- Drag-and-drop dashboard builder for rapid setup
- Automates cross-channel marketing performance dashboards
- White-label reporting with full brand customization
Cons:
- Visual widget customization options are somewhat limited
- Scheduled report delivery sometimes misses send times
Learn more about Whatagraph: Best for governed metric modeling at enterprise scale
- Free trial + free demo available
- Pricing upon request
Visit WebsiteCustomer Rating:4.4/5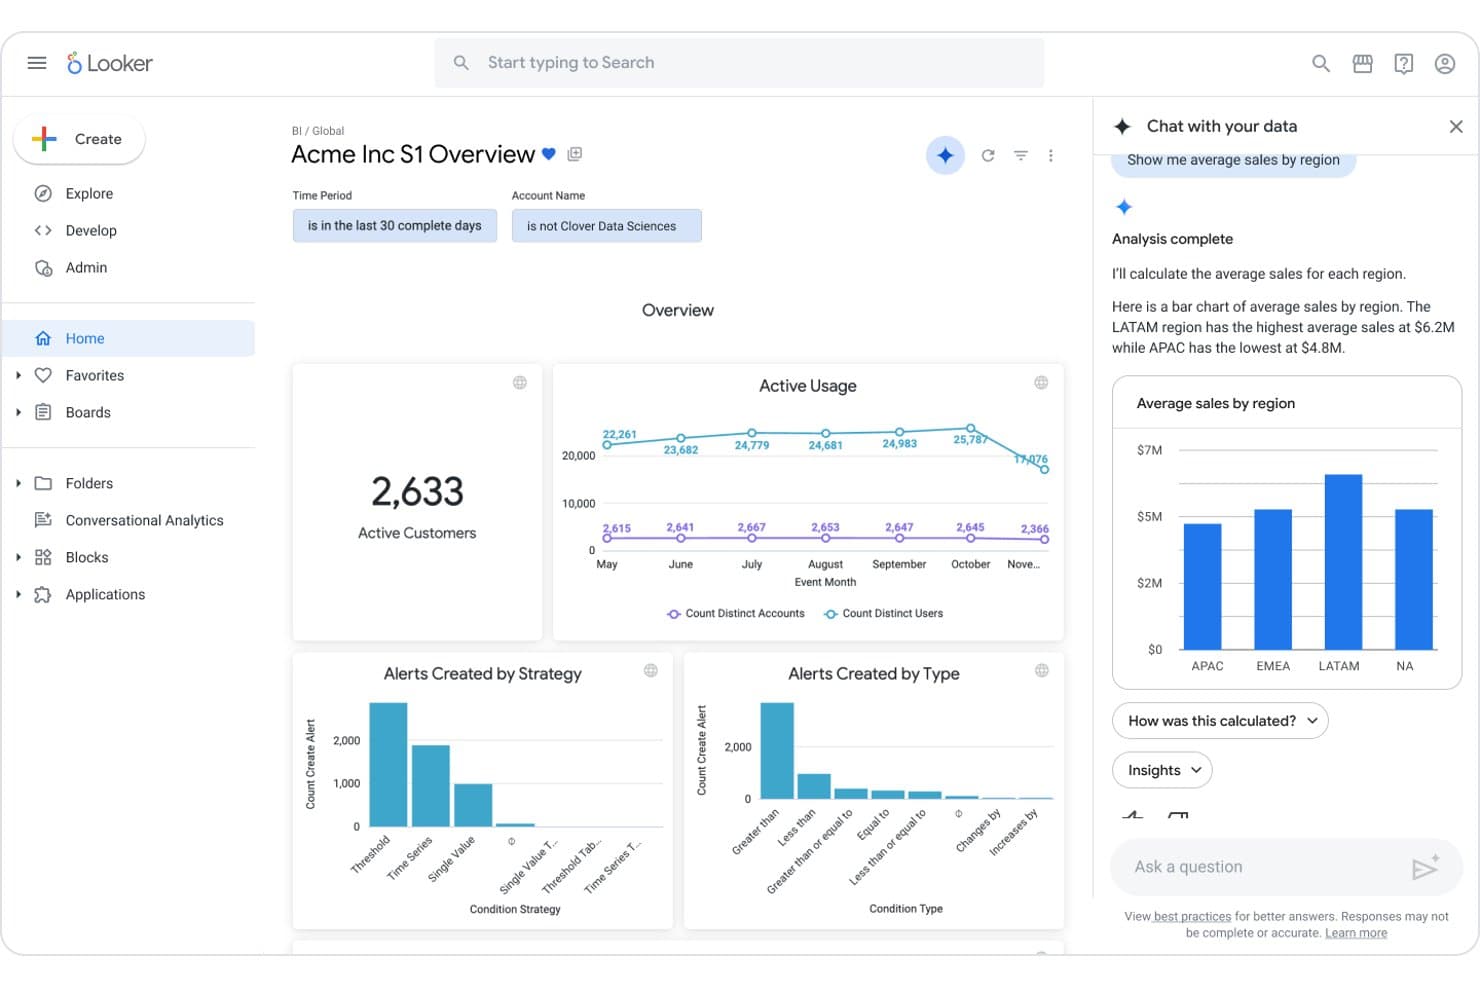
Looker lets users chat with data to surface regional sales insights instantly. Looker is an enterprise analytics platform built for teams who want deeply governed, scalable data modeling and a single source of truth for business metrics across complex organizations.
Who Is Looker Best For?
Looker is a strong choice for large enterprises that need scalable data modeling and centralized control over business analytics.
Why Looker Is a Good Databox Alternative
I picked Looker as a top Databox alternative because I can build governed data models that ensure teams work from a single source of truth. With Looker's semantic modeling layer, I define and standardize metrics across complex systems, making it easy to maintain reporting consistency at scale. I rely on its enterprise-grade controls to manage access and data governance for large organizations.
Looker Key Features
- Custom dashboards: Build interactive dashboards tailored to departments and user roles.
- Embedded analytics: Integrate visualizations and analytics into internal or client-facing applications.
- Data exploration tools: Let users drill down and filter data with intuitive point-and-click controls.
- APIs for data integration: Connect Looker data to other platforms and workflows through RESTful APIs.
Looker Integrations
Looker offers native integrations with Google BigQuery, Snowflake, Amazon Redshift, Microsoft SQL Server, Salesforce, and the Google ecosystem, including Google Sheets and Google Analytics. An API is available for custom integrations.
Pros and Cons
Pros:
- Ad hoc analysis without compromising data consistency
- Highly granular data access controls for governance
- Semantic modeling standardizes business metrics at scale
Cons:
- Limited native visualization flexibility compared to competitors
- Requires significant setup time and modeling skills
Learn more about Looker: 10Best for DAX-modeled revenue metrics in Microsoft 365
Power BI
- Free plan available
- From $14/user/month (billed annually)
Visit WebsiteCustomer Rating:4.8/5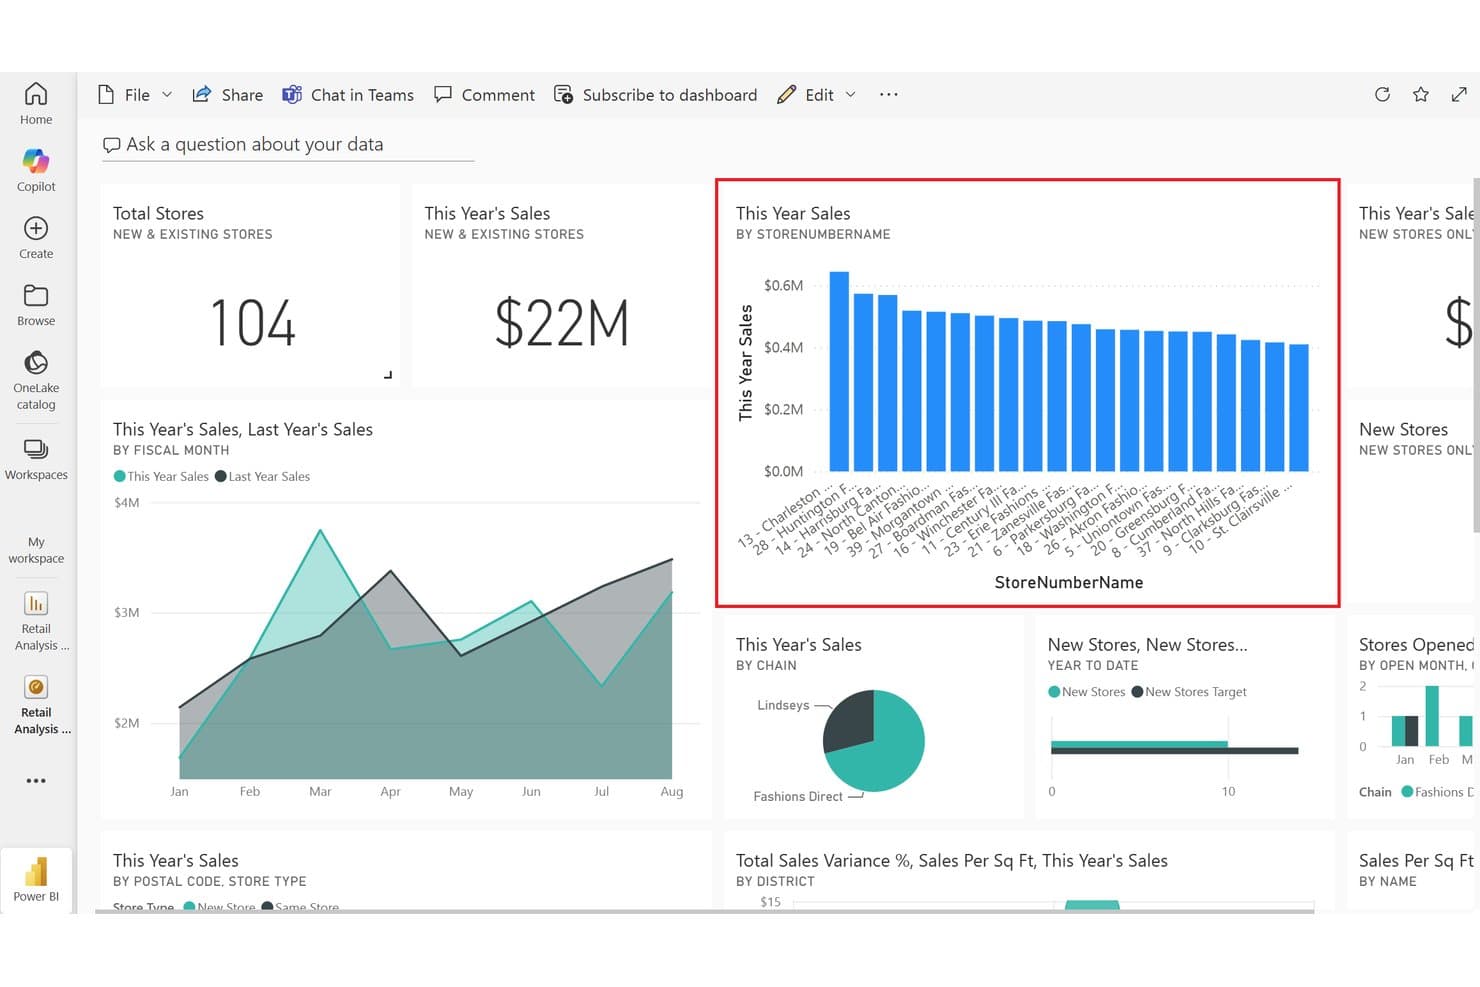
Power BI tracks store-level sales performance across multiple locations. Power BI brings interactive analytics and reporting to teams looking for deep visibility into business metrics, customizable dashboards, and close integration across Microsoft 365 workflows.
Who Is Power BI Best For?
Power BI is a strong fit for revenue operations teams at companies already using Microsoft 365 looking to model and analyze sales and revenue data.
Why Power BI Is a Good Databox Alternative
I picked Power BI as one of the best Databox alternatives because I can model revenue metrics with DAX and pull data directly from Microsoft 365 apps. My team uses custom dashboards to track sales and pipeline performance, and I appreciate how we can drill into visuals to investigate variances in real time.
Power BI Key Features
- Scheduled data refresh: Automatically update dashboards and reports with the latest data on a set cadence.
- Data gateway connectivity: Connect on-premises data sources securely to cloud-based Power BI workspaces.
- Q&A natural language queries: Type questions in plain language to generate visuals and insights from your data.
- Role-based access controls: Set custom permissions for reports, dashboards, and datasets to control what each user can access.
Power BI Integrations
Power BI offers native integrations across the Microsoft ecosystem, including Microsoft 365 and Azure. You can connect it to data sources like Microsoft Access, SharePoint, SQL Server, Exchange Server, and Microsoft Entra ID, and it provides an API for custom integrations.
Pros and Cons
Pros:
- Drill-through capabilities for visual data exploration
- Native compatibility with Microsoft 365 data sources
- Deep DAX modeling for custom revenue metrics
Cons:
- Mobile experience lacks interactive dashboard features
- Desktop app required for advanced report creation
Learn more about Power BI:
Andre alternativer til Databox
Her er noen flere alternativer til Databox som ikke kom med på kortlisten min, men som likevel er verdt å se nærmere på:
- 11Qlik SenseBest for associative revenue data exploration
- 12Zoho AnalyticsBest for Zia AI insights on Zoho CRM data
- 13SisenseBest for AI anomaly detection on complex data
- 14FunnelBest for marketing data pipelines behind KPI dashboards
- 15GoodDataBest for agentic AI on warehouse-native analytics
- 16GrowBest for no-code BI with unlimited user seats
- 17Amazon QuickSightBest for ML anomaly detection on AWS data
- 18NinjaCatBest for AI-agent monitoring across client accounts
- 19SupermetricsBest for piping 150+ marketing sources into BI
- 20SigmaBest for spreadsheet analytics on warehouse data
How I Evaluate Databox Alternatives
I split my evaluation into core functionality every tool must cover—multi-source integrations, KPI dashboards, automated reporting—and differentiators like benchmark data or warehouse sync. Core functionality mirrors what Databox delivers; differentiators separate the field.
Core Functionality (Table Stakes For This List)
When I'm selecting tools for my list, I rank each one on a scale from 0 (does not offer the functionality) to 5 (excels in this area) for each core functionality listed below. I then calculate the tool's total score into a percentage, using 75% as a benchmark to help assess its overall fit for the list.
- Multi-source integrations: I check how many native connectors each tool offers across CRM, ad platforms, marketing automation, and finance systems your revenue team actually uses.
- Customizable dashboards: Each tool gets evaluated on its dashboard builder—drag-and-drop layout control, widget variety, and whether you can build role-specific views without writing code.
- Automated reporting: I look for scheduled report delivery across email, Slack, and shareable links, plus options like white-labeled outputs for agency teams managing multiple clients.
- Real-time metric tracking: Refresh frequency matters. I evaluate whether data updates happen sub-hourly and whether the tool supports threshold-based alerts so you catch pipeline shifts early.
- Goal and KPI management: Tools like Power BI and Klipfolio handle goal tracking differently, so I compare how each one lets you set targets, visualize pacing, and monitor progress across teams.
- Custom metrics and calculations: I evaluate whether you can blend fields across sources and build reusable calculated metrics—for example, combining CRM deal data with ad spend to track blended CAC.
Once I have a list of tools that meet the criteria, I consider what sets each platform apart.
Differentiating Factors (What Sets Vendors Apart)
Here's how I compare and contrast different vendors:
Standout Features
I evaluate whether a tool offers benchmark data—comparing your pipeline velocity or win rates against anonymized industry medians changes how you set targets. Data warehouse sync also matters: tools like Looker and Klipfolio let you model attribution in BigQuery or Snowflake and visualize results in the same platform, so your metric logic stays governed in one place. For agencies, I check white-label client portals with per-client permissions, since branded reporting across dozens of accounts is a daily workflow in multi-client RevOps.
Beyond Features
Pricing model matters because per-user fees look affordable until you add 30 dashboard viewers across sales, marketing, and CS. I check whether a tool charges per seat, per data source, or per row volume—and whether overage fees on API calls or refresh rates inflate costs as your stack grows. Time-to-value is equally important: I look for pre-built RevOps templates and guided onboarding that get dashboards live in days, not quarters. For data governance, I evaluate SSO, audit logs, and row-level security, since cross-functional dashboards often expose pipeline and financial data to mixed audiences.
Hvorfor se etter et alternativ til Databox?
Det finnes flere grunner til at noen brukere ser etter alternative løsninger. Du ser kanskje etter et alternativ til Databox fordi …
- Du trenger mer omfattende eller mer detaljert datamodellering
- Du ønsker bredere integrasjonsdekning på tvers av teknologistakken din
- Du skal støtte kompleks RevOps-rapportering eller rapportering på tvers av flere enheter
- Du trenger avansert datastyring og sikkerhetskontroller
- Du skal skalere utover Databox’ pris- eller brukerbegrensninger
Hvis noe av dette høres kjent ut, har du kommet til rett sted. Listen min inneholder flere alternativer til Databox som er bedre egnet for team som møter disse utfordringene med Databox og ser etter alternative løsninger.
Viktige funksjoner i Databox
Her er noen av de viktigste funksjonene i Databox, slik at du kan sammenligne hva alternative løsninger tilbyr:
- Dataintegrasjoner fra flere kilder: Kobler sammen data fra CRM-systemet, annonseplattformer, regneark, databaser og skyverktøy, slik at du kan samle måltall fra alle inntektskanalene dine i ett kontrollpanel.
- Tilpassbare kontrollpaneler: Med en dra-og-slipp-bygger for kontrollpaneler kan du opprette rollebaserte visninger med diagrammer, grafer og tabeller, slik at hvert team bare ser måltallene som er relevante for arbeidet deres.
- Automatisert rapportering: Konfigurer planlagte rapporter som leveres til e-posten din, Slack eller via delte lenker, slik at du kan holde interessenter oppdatert uten manuelt arbeid.
- Sporing av måltall i sanntid: Overvåker KPI-ene og inntektstallene dine med hyppige oppdateringer, slik at dataene alltid er oppdaterte og du kan oppdage endringer i salgspipelinen umiddelbart.
- Mål- og KPI-styring: Opprett mål, visualiser fremdriften og overvåk utviklingen på tvers av team for å samle alle rundt de samme inntektsmålene og gjøre resultatene målbare.
- Tilpassede måltall og beregninger: Kombiner felt på tvers av flere datakilder med beregnede måltall, slik at du kan følge sammensatte måltall som CAC, LTV eller tilpassede inntektsformler som er skreddersydd for virksomhetens behov.
- Varsler og meldinger: Konfigurer terskelbaserte varsler for viktige måltall, slik at teamet ditt får umiddelbar beskjed når tallene overskrider kritiske grenser.
- Alternativer for datavisualisering: Velg blant et bredt utvalg av widgeter og diagramtyper for å presentere dataene på den måten som er mest handlingsrettet for ulike målgrupper.
- Oppsett uten kode: Utform kontrollpaneler og bygg rapporter uten å skrive kode, noe som gjør løsningen tilgjengelig for RevOps-team og forretningsbrukere som ikke er tekniske spesialister.
- Støtte for mobilapp: Få tilgang til kontrollpaneler og KPI-er på mobilenheten din, slik at du kan overvåke inntektsresultatene og motta varsler mens du er på farten.
Kostnader og priser
For å velge alternativer til Databox må du forstå de ulike prismodellene og abonnementene som er tilgjengelige. Kostnadene varierer basert på funksjoner, teamstørrelse, tillegg og mer. Tabellen nedenfor oppsummerer vanlige abonnementer, gjennomsnittsprisene deres og typiske funksjoner som er inkludert i løsninger som er alternativer til Databox:
Sammenligningstabell for abonnementer for alternativer til Databox
| Abonnementstype | Gjennomsnittspris | Vanlige funksjoner |
|---|---|---|
| AbonnementstypeGratisabonnement | Gjennomsnittspris$0 | Vanlige funksjonerGrunnleggende kontrollpaneler, begrensede integrasjoner, kjernefunksjoner for sporing av måltall og brukerstøtte fra fellesskapet. |
| AbonnementstypePersonlig abonnement | Gjennomsnittspris$5–$20/bruker/måned | Vanlige funksjonerStandard kontrollpaneler, flere integrasjoner, planlagt rapportering, sanntidsoppdateringer og brukerstøtte via e-post. |
| AbonnementstypeBedriftsabonnement | Gjennomsnittspris$25–$75/bruker/måned | Vanlige funksjonerAvanserte kontrollpaneler, integrasjon fra flere kilder, tilpassede måltall, automatiserte varsler, teamsamarbeid og rollebasert tilgang. |
| AbonnementstypeForetaksabonnement | Gjennomsnittspris$100–$250+/bruker/måned | Vanlige funksjonerUbegrensede integrasjoner, synkronisering med datavarehus, avansert sikkerhet, portaler med egen merkevare, dedikert oppstart og SLA-er. |