Le 10 migliori soluzioni di BI self-service recensite per il 2026

10 Migliori Strumenti di BI Self-Service - La Shortlist


Con così tanti strumenti di BI self-service disponibili, è difficile capire quale sia il più adatto. Vuoi rendere l’analisi dei dati più accessibile e intuitiva per tutto il tuo team, ma non sai quale soluzione scegliere. Ti aiuto io! In questo articolo ti guiderò nella scelta, condividendo le mie esperienze personali con decine di software di BI self-service utilizzati con diversi team e set di dati, presentandoti le mie scelte dei migliori strumenti di BI self-service.
Why Trust Our Software Reviews
We’ve been testing and reviewing RevOps software since 2022. As RevOps leaders ourselves, we know how critical and difficult it is to make the right decision when selecting software.
We invest in deep research to help our audience make better software purchasing decisions. We’ve tested more than 2,000 tools for different RevOps use cases and written over 1,000 comprehensive software reviews. Learn how we stay transparent & our software review methodology.
Riepilogo dei Migliori Strumenti di BI Self-Service
Questo grafico comparativo riassume i dettagli dei prezzi per le mie scelte migliori di strumenti di BI self-service, aiutandoti a trovare quello più adatto al tuo budget e alle esigenze della tua azienda.
| Tool | Best For | Trial Info | Price | ||
|---|---|---|---|---|---|
| 1 | Best for spreadsheet-based live reporting | Free plan available | From $49/month (billed annually) | Website | |
| 2 | Best for extensive data integration | 15-day free trial + free plan + free demo available | From $24/month (billed annually) | Website | |
| 3 | Best for automated, self-explaining dashboards | Free plan available | From $29/month | Website | |
| 4 | Best for upskilling employees in BI development | Free trial available | From $250/user/month (billed annually) | Website | |
| 5 | Best for delivering trusted data experiences from the cloud of your choice | Free plan available | From $9/user/project/month | Website | |
| 6 | Best for accessing insights in real time | 30-day free trial + free demo available | Pricing upon request | Website | |
| 7 | Best for accessing auto SQL generation | 14-day free trial + free demo available | From $13/user/month | Website | |
| 8 | Best for web-based data modeling | 30-day free trial available | From $10/user/month | Website | |
| 9 | Best for acting on data at the point of insight | Free trial available | From $75/user/month | Website | |
| 10 | Best for versatile implementation on-premise or in the cloud | 30-day free trial available | From $162.30/month for up to 10 users | Website |
-

Prisync
Visit WebsiteThis is an aggregated rating for this tool including ratings from Crozdesk users and ratings from other sites.4.7 -
Expedite Commerce
Visit Website -
QuickBooks Online
Visit WebsiteThis is an aggregated rating for this tool including ratings from Crozdesk users and ratings from other sites.4


Recensioni dei Migliori Strumenti di BI Self-Service
Di seguito trovi i miei riepiloghi dettagliati dei migliori strumenti di BI self-service che sono entrati nella mia shortlist. Le mie recensioni offrono un’analisi approfondita delle principali funzionalità, punti di forza e di debolezza, integrazioni e casi d’uso ideali di ciascun tool per aiutarti a trovare quello più adatto a te.
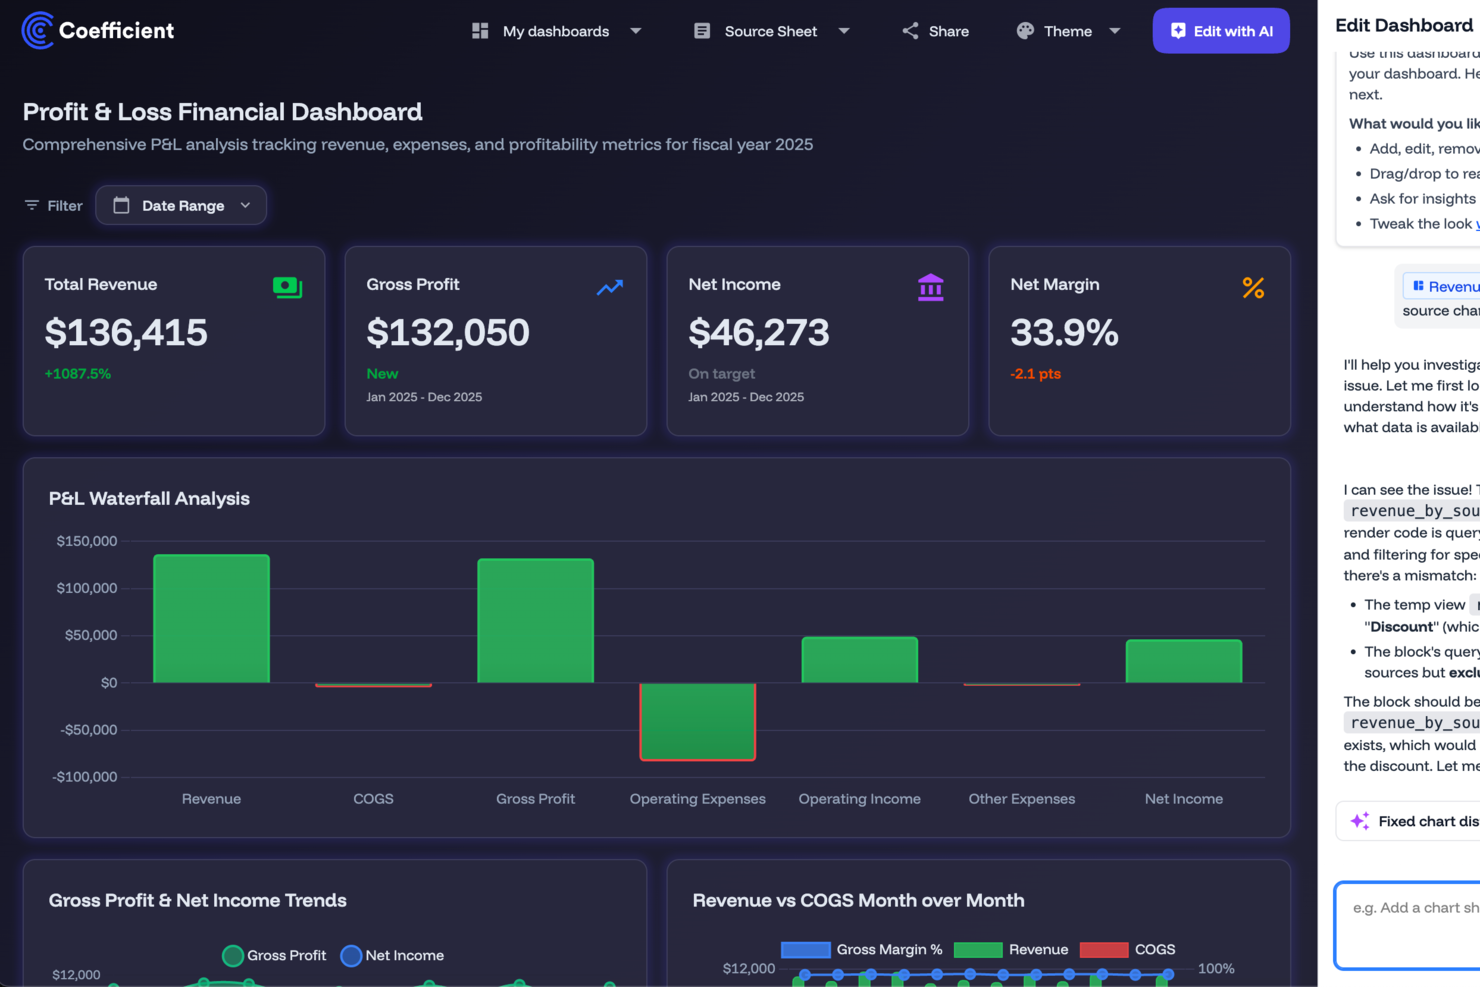
For teams seeking to elevate their data management and reporting capabilities, Coefficient offers a unique self-service BI solution. This tool appeals to finance, marketing, and analytics professionals who value AI-powered insights and streamlined workflows. Coefficient addresses the need for real-time data analysis and decision-making without the need for complex coding, making it an ideal choice for businesses looking to enhance operational efficiency.
Why I Picked Coefficient
I chose Coefficient because it’s an efficient way to achieve self-service BI without forcing users to learn a heavy, specialized analytics platform. It specifically solves the stale data problem by maintaining a live link between your spreadsheet and your data sources. Its AI modeling feature allows you to perform complex forecasting directly within spreadsheets, catering to the analytical needs of your team. These features make Coefficient a compelling choice for anyone looking to leverage self-service BI tools for enhanced data-driven strategies.
Coefficient Key Features
In addition to its AI capabilities, Coefficient includes several features that enhance its value as a self-service BI tool:
- Live dashboard creation: Build interactive web dashboards with real-time data visualizations.
- Scheduled auto-refresh: Automatically update reports and dashboards on a schedule that fits your team’s needs, eliminating manual exports.
- Automated alerts: Receive Slack or email notifications when key metrics change, enabling faster response times.
- Custom connectors: Create custom connectors to link spreadsheets with various systems for flexible data integration.
Coefficient Integrations
Integrations include Salesforce, QuickBooks, Snowflake, HubSpot, MySQL, Google Analytics, Shopify, Stripe, Redshift, and more.
Pros and Cons
Pros:
- Enables self-service BI directly within familiar spreadsheet environments
- Supports real-time data monitoring with automated alerts and refreshes
- Flexible integrations through native connectors and custom API options
Cons:
- Less suitable for teams seeking a traditional BI platform
- Primarily designed for spreadsheet-based analysis workflows
Zoho Analytics is a self-service business intelligence (BI) and data analytics software. It allows users to analyze their data, create data visualizations, and discover hidden insights quickly. The platform allows users to create dashboards and analyze data, facilitating smarter decision-making.
Why I picked Zoho Analytics: It offers extensive data integration, supporting a wide range of data sources, including files, databases, and various Zoho applications, making it a versatile tool for data analysis. It also includes a drag-and-drop interface, which simplifies the process of creating reports and dashboards. This feature is particularly beneficial for users with limited technical expertise.
Zoho Analytics Standout Features and Integrations
Standout features include various visual views like charts, pivot tables, and summary views, advanced analytics like trend analysis, forecasting, and regression, and an AI-powered assistant, Zia that offers natural language query capabilities for users to ask questions and receive insights without manual data manipulation.
Integrations include Zoho CRM, Microsoft Dynamics CRM, Salesforce CRM, HubSpot CRM, Google Ads, Google Analytics 4 (GA4), Jotform, Infraspeak, Repsly, VanillaSoft, ClickUp, WordPress, Podio, and Google Forms.
Pros and Cons
Pros:
- Live, customizable dashboards
- Excellent visual representation of data
- Can integrate with many data sources, including on-premise systems
Cons:
- Mobile app sometimes has delayed notifications
- Potential learning curve when customizing dashboards

Signara is an automated BI reporting tool that generates dashboards and plain-language narrative summaries directly from your connected data sources, with no SQL, DAX, or manual configuration required.
Who Is Signara Best For?
Signara is a good fit for marketing and finance teams at small to mid-sized businesses that need automated reporting without dedicated BI engineers or data analysts on staff.
Why I Picked Signara
I've included Signara in my top picks because of how fast you can go from raw data to a finished dashboard. The schema mapping and KPI detection happen automatically once you connect a data source, so there's no configuration layer to work through before you see results. I particularly like the drag-and-drop upload for Excel and CSV files, which means teams without any data infrastructure can still get output in minutes. There's no SQL, no DAX, and no report-building required.
Signara Key Features
- AI-generated narrative summaries: Signara automatically writes plain-language explanations of your KPI movements alongside each dashboard.
- Deterministic KPI engine: All calculations are code-based and auditable, so your reported numbers are consistent and traceable.
- Native data connectors: Connect directly to sources like HubSpot, Snowflake, BigQuery, GA4, and PostgreSQL without any middleware.
- PPTX export: Export finished reports as PowerPoint files ready for stakeholder presentations.
Signara Integrations
Signara offers native integrations with HubSpot, Google Analytics (GA4), Google Sheets, Snowflake, Databricks, BigQuery, PostgreSQL, and MySQL, and also supports drag-and-drop uploads for Excel and CSV files.
Pros and Cons
Pros:
- Reports generated from raw data instantly
- QR code sharing skips login barriers
- AI narratives explain what changed automatically
Cons:
- No custom SQL query editor available
- Lacks complex physical report exporting
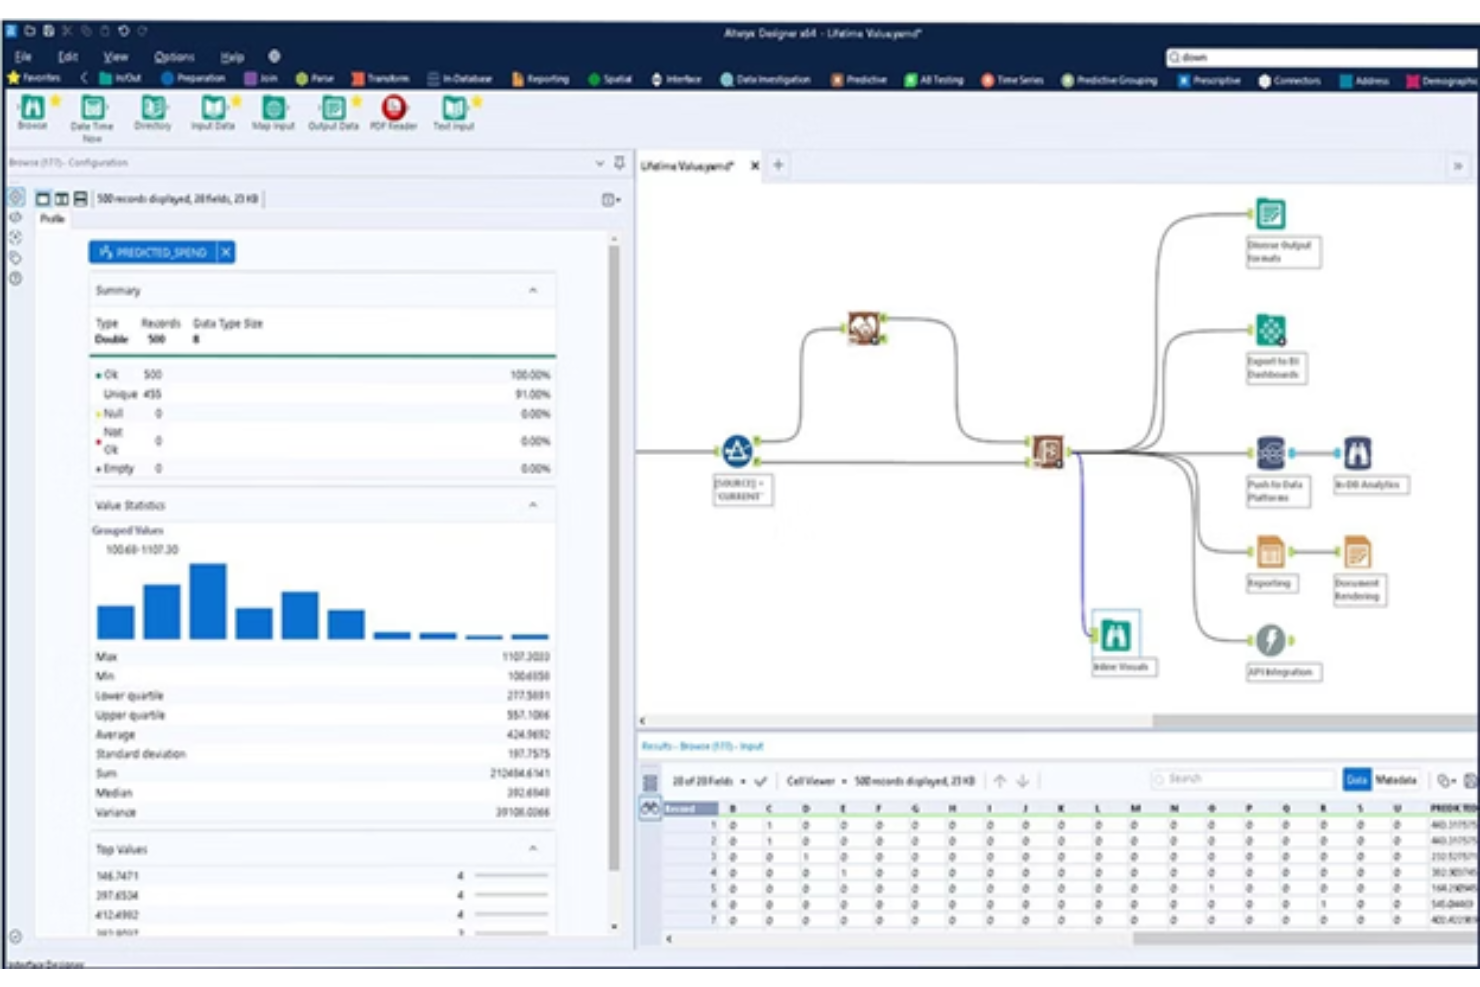
This cloud-based BI tool offers you the chance to automate every part of your analytics, from data prep to data science. Alteryx provides access to any data type or source, allowing you to blend all information through an intuitive drag-and-drop interface. This platform provides both no-code and low-code processes.
Why I picked Alteryx: What I really like about this platform is the focus on accelerating the time to value of BI tools by helping your team learn as much as possible about the program in the shortest amount of time. Whether it’s through built-in best practices, a learning program, or solutions shared by the Alteryx community, you have the tools to optimize implementation.
Alteryx Standout Features and Integrations
Standout features include automated machine learning with no coding required for non-technical users and data storytelling that explains insights in simple, clear language.
Integrations include Adobe Analytics, CARTO, DataRobot, Immuta, Microsoft Azure, Oracle, Syniti Matching, Tableau, UiPath, and Veritone Automate Studio.
Pros and Cons
Pros:
- Academy and learning tools for new users
- Comprehensive feature list
- The interface is very easy to use
Cons:
- Platform is pretty high priced
- Can be slow with a bad internet connection
Looker
Best for delivering trusted data experiences from the cloud of your choice
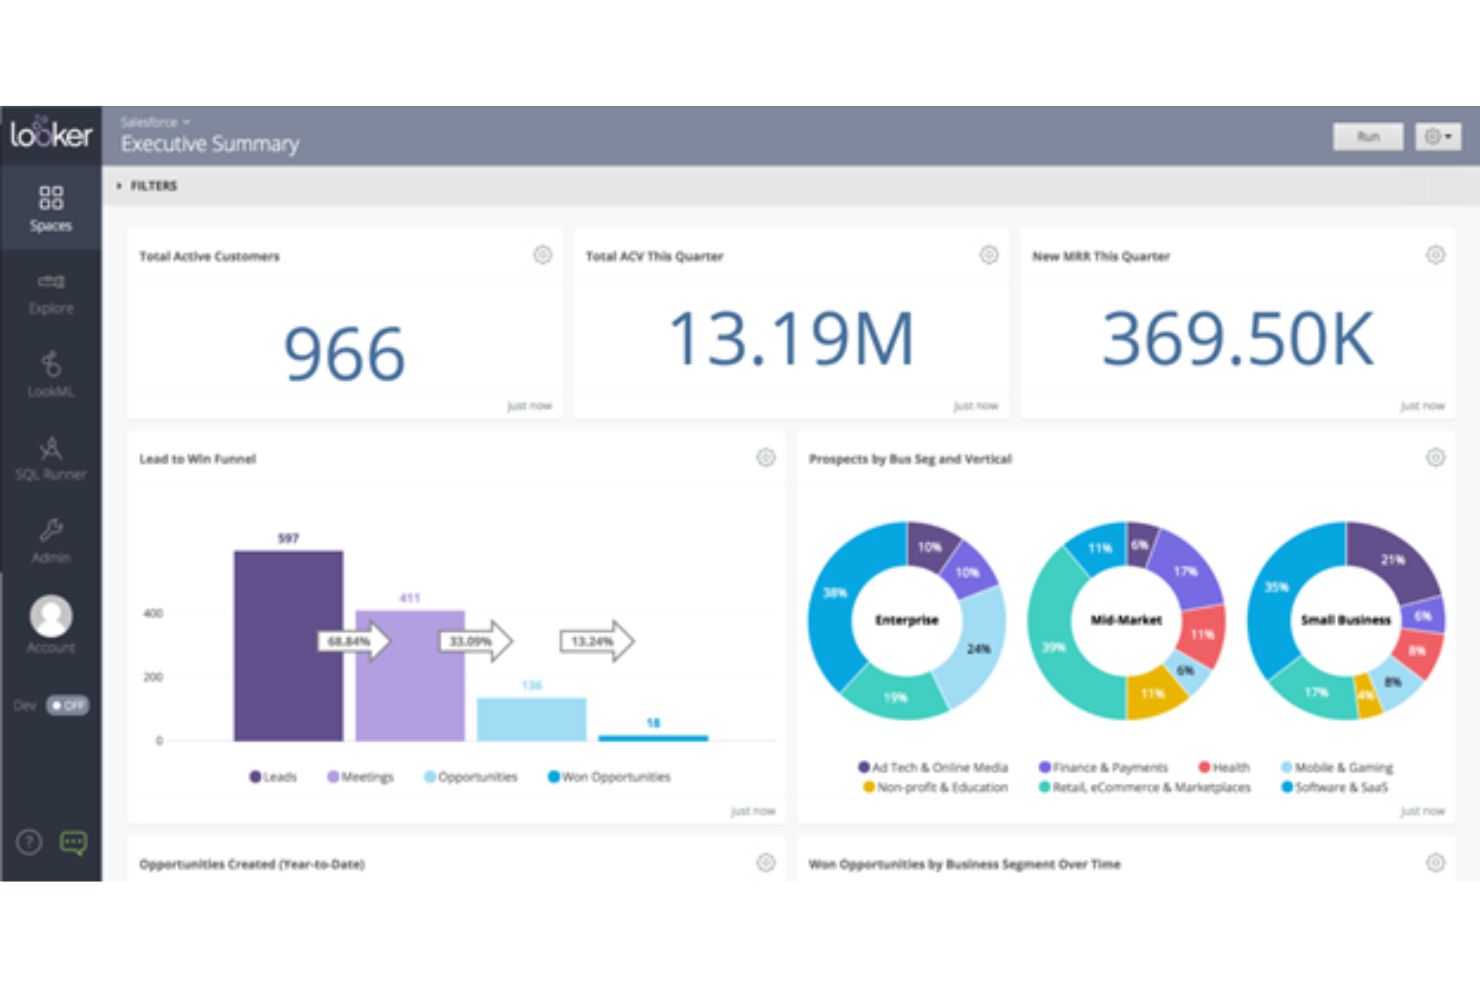
Now a part of Google Cloud, Looker is a BI platform that strives to ensure an intuitive approach of data exploration to end users. With the web-based interface, Looker enables you to build and share reports so that your organization can develop insight-powered workflows.
Why I picked Looker: This tool seemed to be particularly valuable for its close association with Google. The platform is built on Google Cloud infrastructure and is available as a service to integrate with any existing cloud portfolio in the Google Cloud console to ensure you have an accessible place to start and manage Looker instances.
Looker Standout Features and Integrations
Standout features include LookML that creates SQL queries on behalf of users and Looker Studio that connects you to a semantic model for analysis, exploration, and visualization.
Integrations include Asana, Dropbox Business, Google Analytics 360, Google Workspace, HubSpot, Mailchimp, Microsoft Excel, Rippling, Salesforce, and Slack.
Pros and Cons
Pros:
- Free tools are available
- Intuitive navigation and learning process
- User-friendly design and interface
Cons:
- Mostly online support through forums and FAQs
- Delayed performance for large data sets
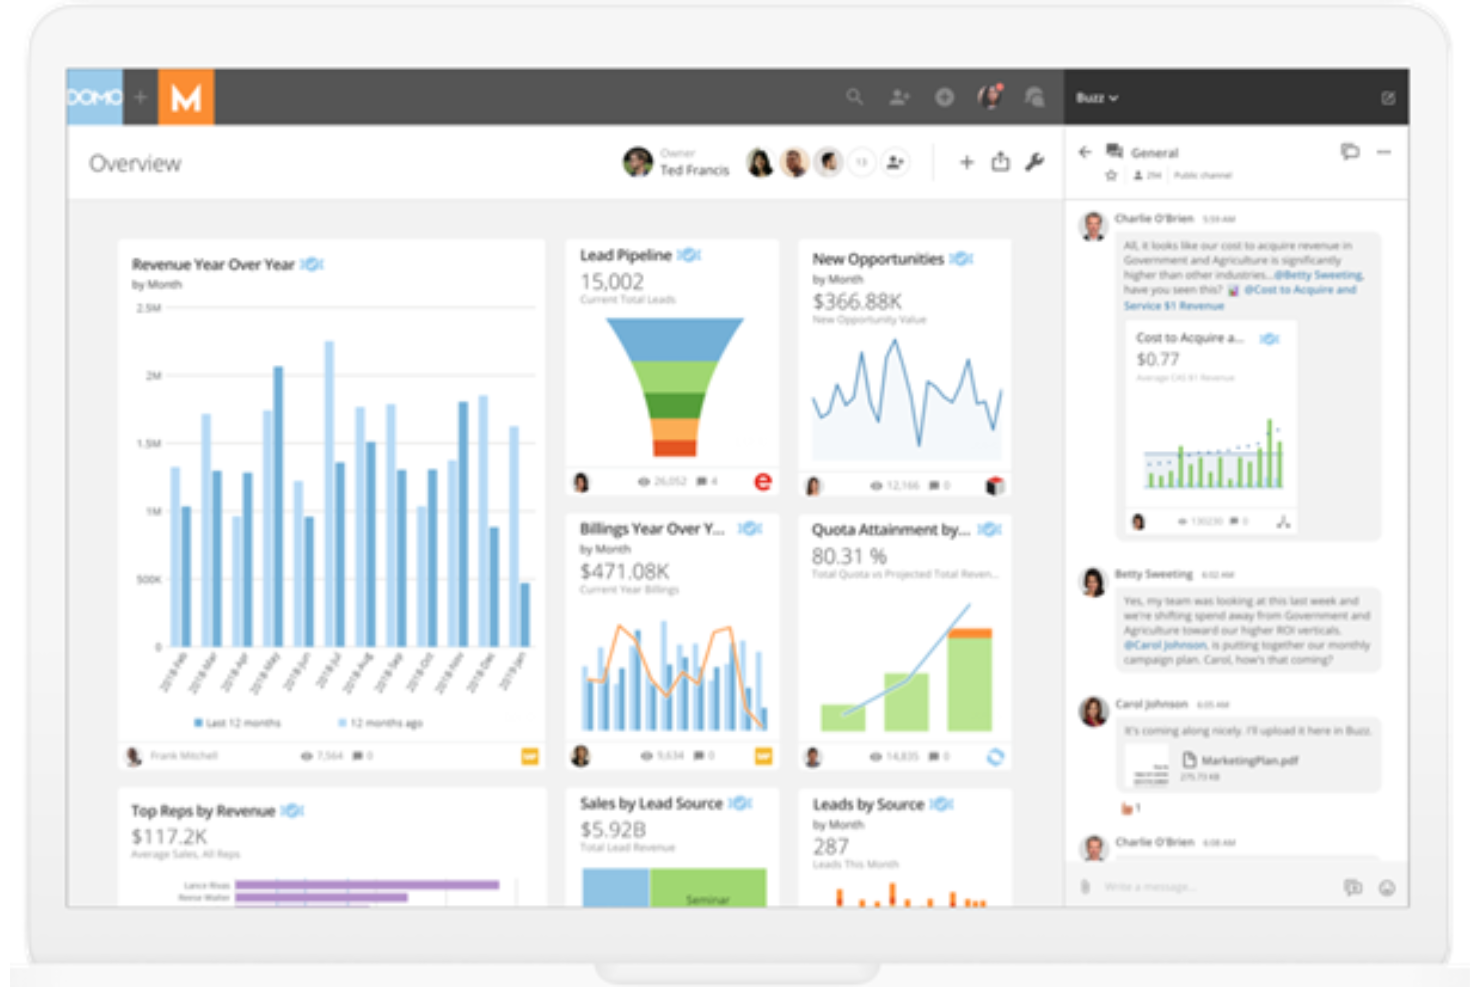
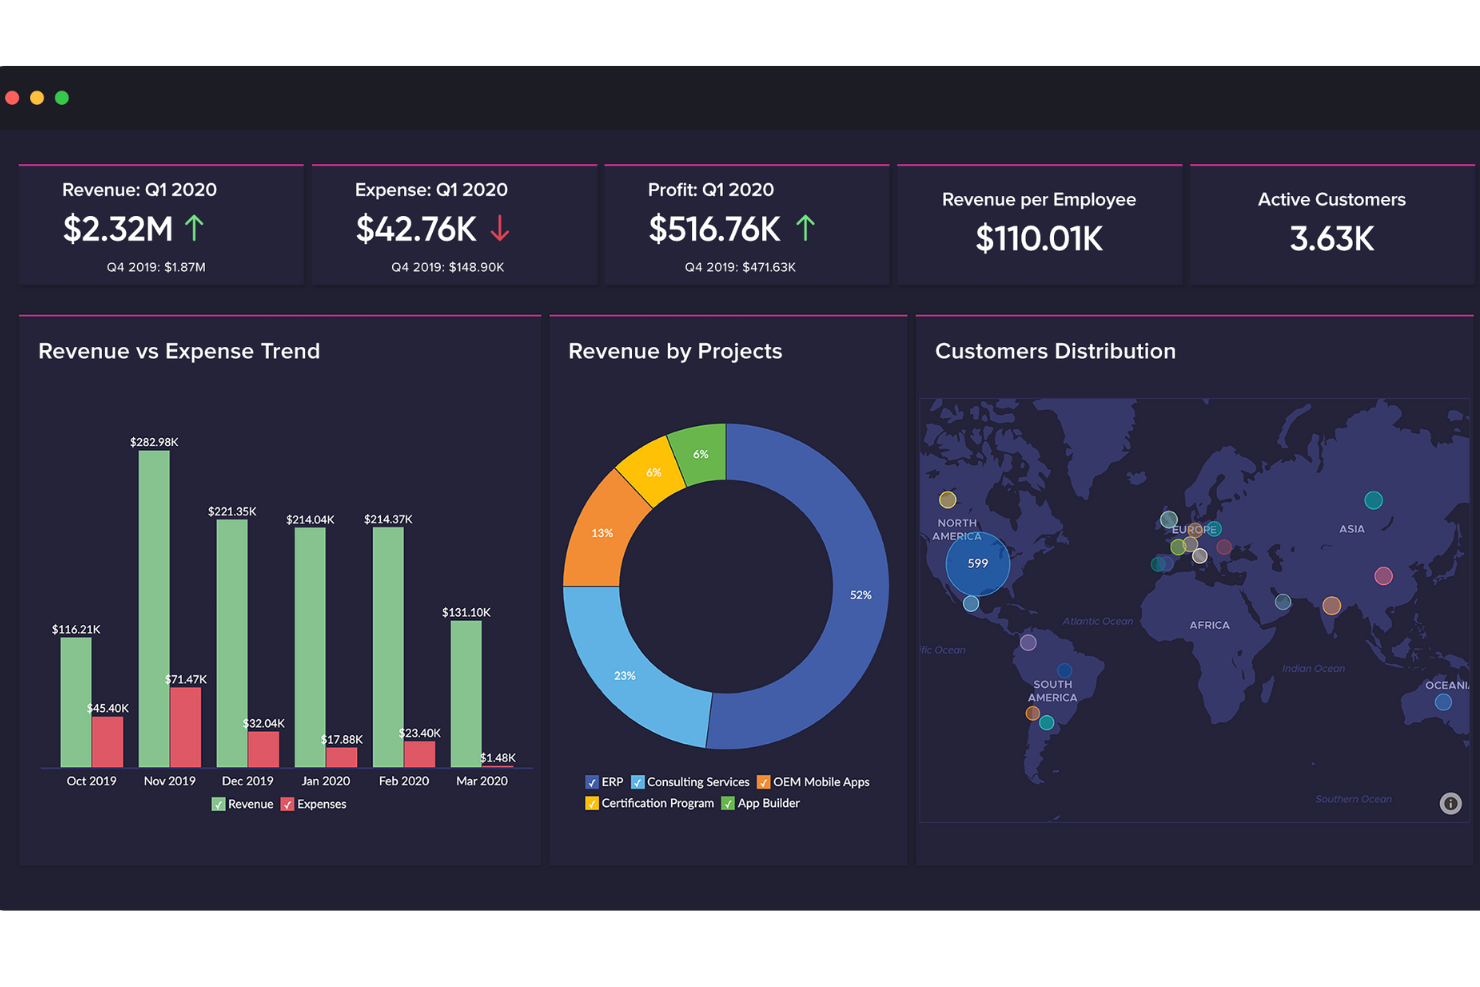
With its self-service reporting and analytics features, Domo can multiply the impact of analytics on your business by getting everyone involved with this cloud-native platform. It goes beyond traditional BI to make data more visible, actionable, and user-friendly through intuitive dashboards and apps, helping you optimize business processes at scale.
Why I picked Domo: While this should be an industry standard, this tool caught my eye because it prioritizes the shift from static data to real-time data with automated reporting that constantly gets fed a stream of fresh information to ensure accuracy no matter when or where you’re looking at your reporting.
Domo Standout Features and Integrations
Standout features include drag-and-drop ETL tools that make it easier to pull data from multiple sources and automated report scheduling to send updates to key stakeholders.
Integrations include Basecamp, DocuSign, Dropbox Business, GitHub, Google Analytics 365, Google Drive, Mailchimp, Microsoft Excel, SurveyMonkey, and Trello.
Pros and Cons
Pros:
- Customizable user interface
- OOB connector is simple to use
- Easy to build visualizations
Cons:
- Non-technical customer support
- No ability to link data sets
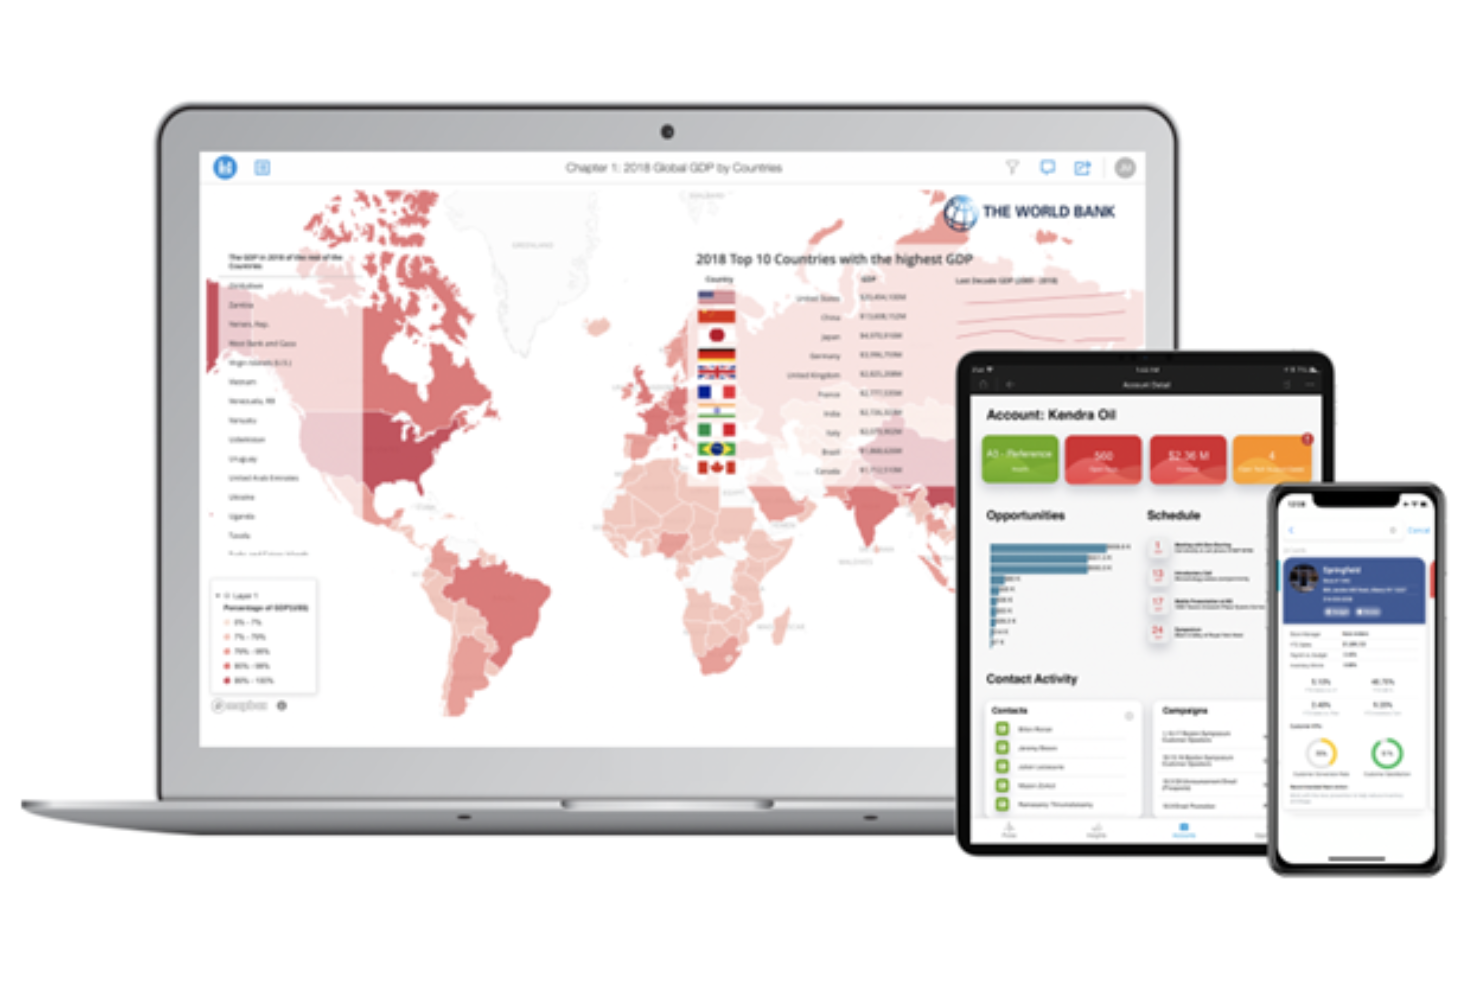
This self-service BI platform is built to ensure you can make faster business decisions with tools that help explore data and share insights in minutes. With intuitive visualizations, mobile accessibility, unlimited data sources, and drag-and-drop functionality, anyone in your organization can analyze and showcase relevant metrics with versatile reporting tools.
Why I picked MicroStrategy: I chose this platform because it offers an easier way to query your data. Instead of dealing with SQL complexity, MicroStrategy can automatically generate accurate SQL queries to answer business questions. This feature uses natural language processing to translate plain text into SQL for you.
MicroStrategy Standout Features and Integrations
Standout features include versatile data connectors that can ensure you have access to unlimited sources and AI-powered chatbot that can help explain the data they’re seeing to your team.
Integrations include Amazon Redshift, Cloudera, databricks, Google, Microsoft 365, Microsoft Excel, MongoDB, Salesforce, Snowflake, and Vibe.
Pros and Cons
Pros:
- Flexible and robust BI tool
- Intuitive navigation and interface
- Easy to understand tools
Cons:
- Costs can be higher than average
- Older interface designed years ago
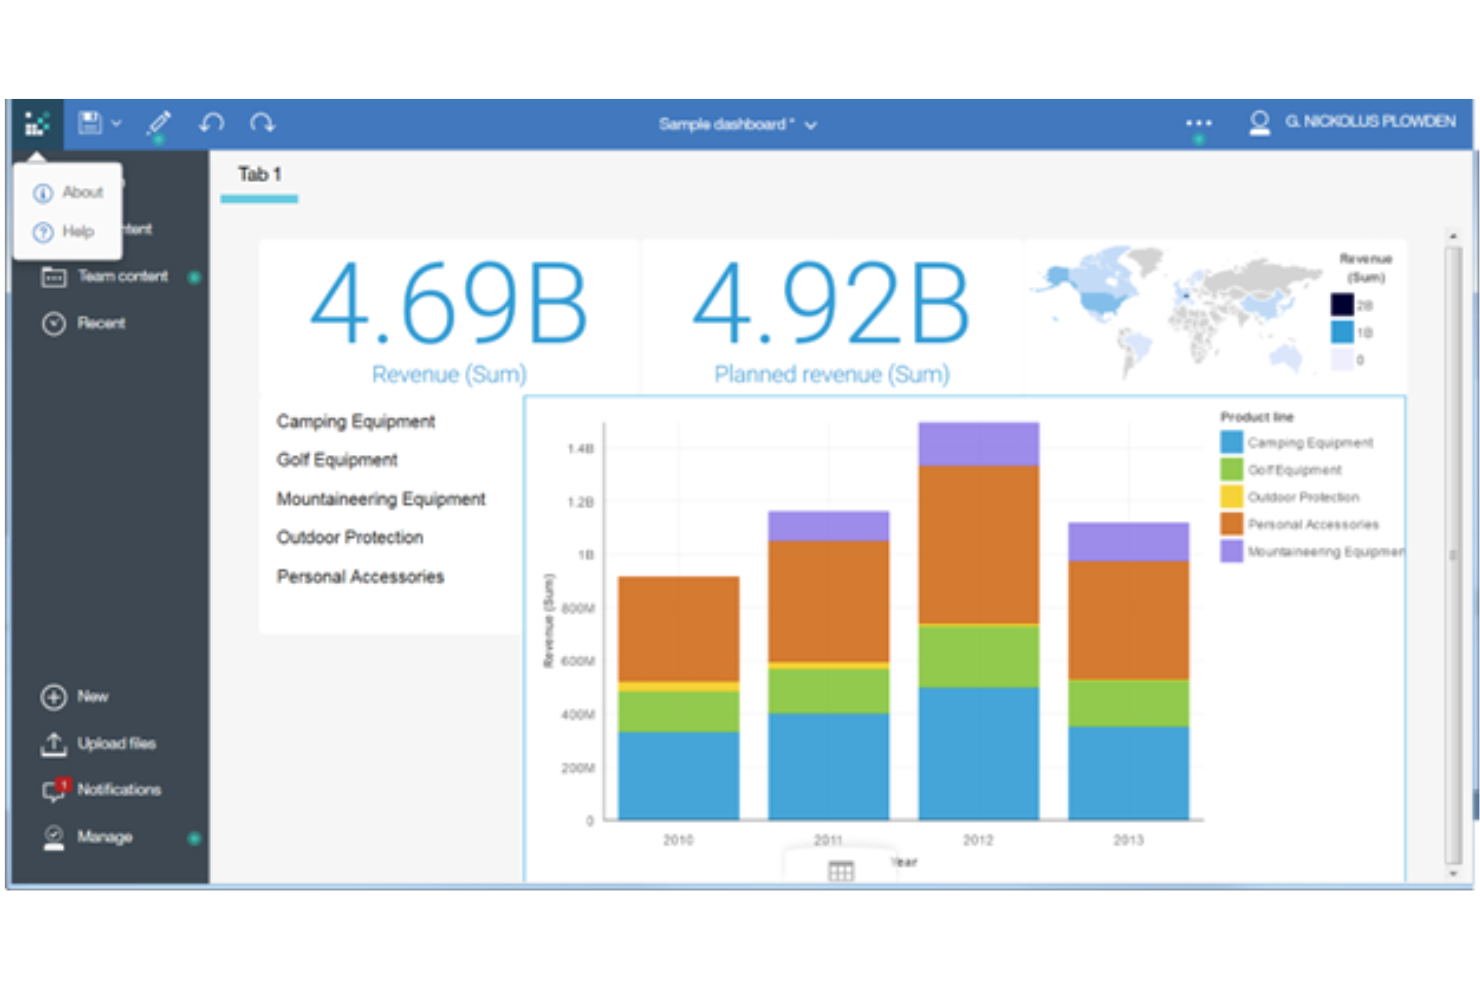
As part of the IBM family of business intelligence products, Cognos Analytics is tailored to provide solutions to organizations of all shapes and sizes with standard BI features and advanced solutions, including ad hoc reporting, real-time monitoring, strategy management, performance scorecards, and forecasting. Use this tool to automate workflows and integrations.
Why I picked Cognos Analytics: The reason this platform caught my eye is because of its web-based versatility. With web access on any device, you can more easily upload, join, connect, and model data from a variety of sources using decision trees, predictive forecasting, and AI assistants.
Cognos Analytics Standout Features and Integrations
Standout features include built-in AI to accelerate data prep, automated data exploration to surface hidden insights, and collaboration tools to share data visualizations.
Integrations include CommandCenterHD, eCMS, Husky Intelligence, Key Survey, Limelight, LoginERP, MongoDB, SAP Fieldglass, Slack, and VisualCron.
Pros and Cons
Pros:
- AI-driven data visualization
- Easy to automate and schedule tasks
- No need to know SQL
Cons:
- Performance lag with large data sets
- Joining data sources can be clunky
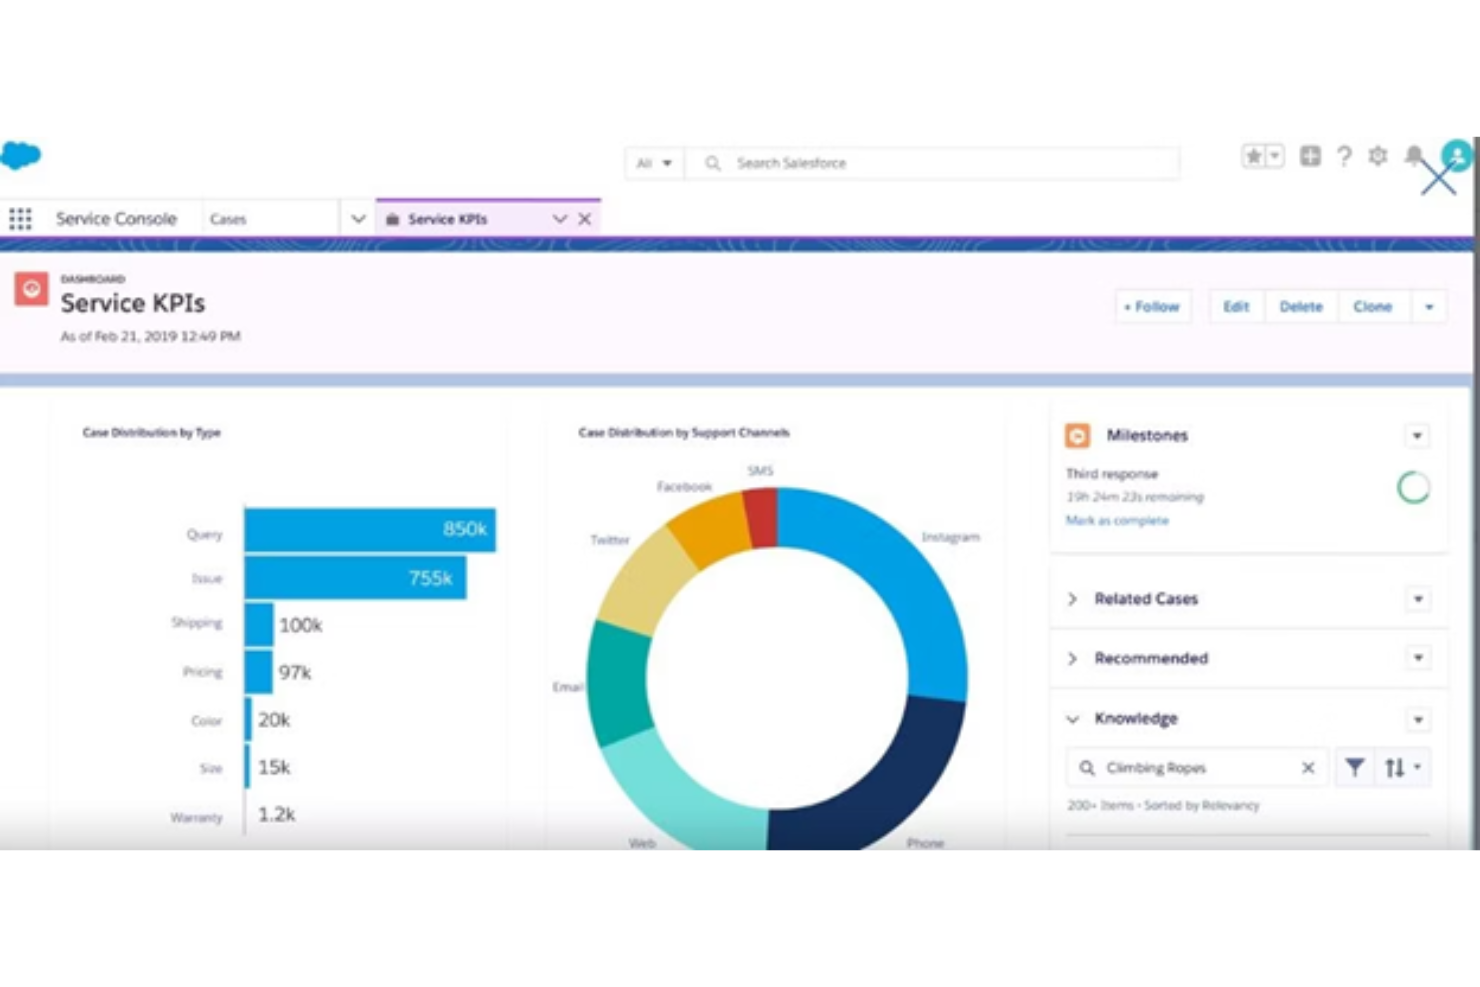
As an artificial intelligence-driven BI platform, Salesforce Einstein Analytics delivers a feature-rich data visualization and analysis solution with end-to-end capabilities. Utilize the power of AI to analyze billions of data combinations across marketing, service, and sales for smarter, faster decision-making.
Why I picked Einstein Analytics Platform: This tool made my list because it has a feature called Einstein Actions. Now, you can take action more quickly the moment you gain a new insight with built-in functionality for creating tasks, sharing insights, and updating records without having to wait for legacy technology to catch up.
Einstein Analytics Platform Standout Features and Integrations
Standout features include a mobile-first approach that makes Einstein accessible on any device, even smart watches, and contextual dashboards through Tableau to embed visualizations across the platform.
Integrations include Accounting Seed, Conga Grid, Oracle, RollUp Helper, SAP, SurveyMonkey, Tableau, Viostream, Wave, and Whatfix.
Pros and Cons
Pros:
- Friendly and accessible customer support
- Easy to set up using a “Trailhead”
- Designed to be versatile across various industries
Cons:
- Limited data that you can use
- Requires a limited analytics license
Best for versatile implementation on-premise or in the cloud
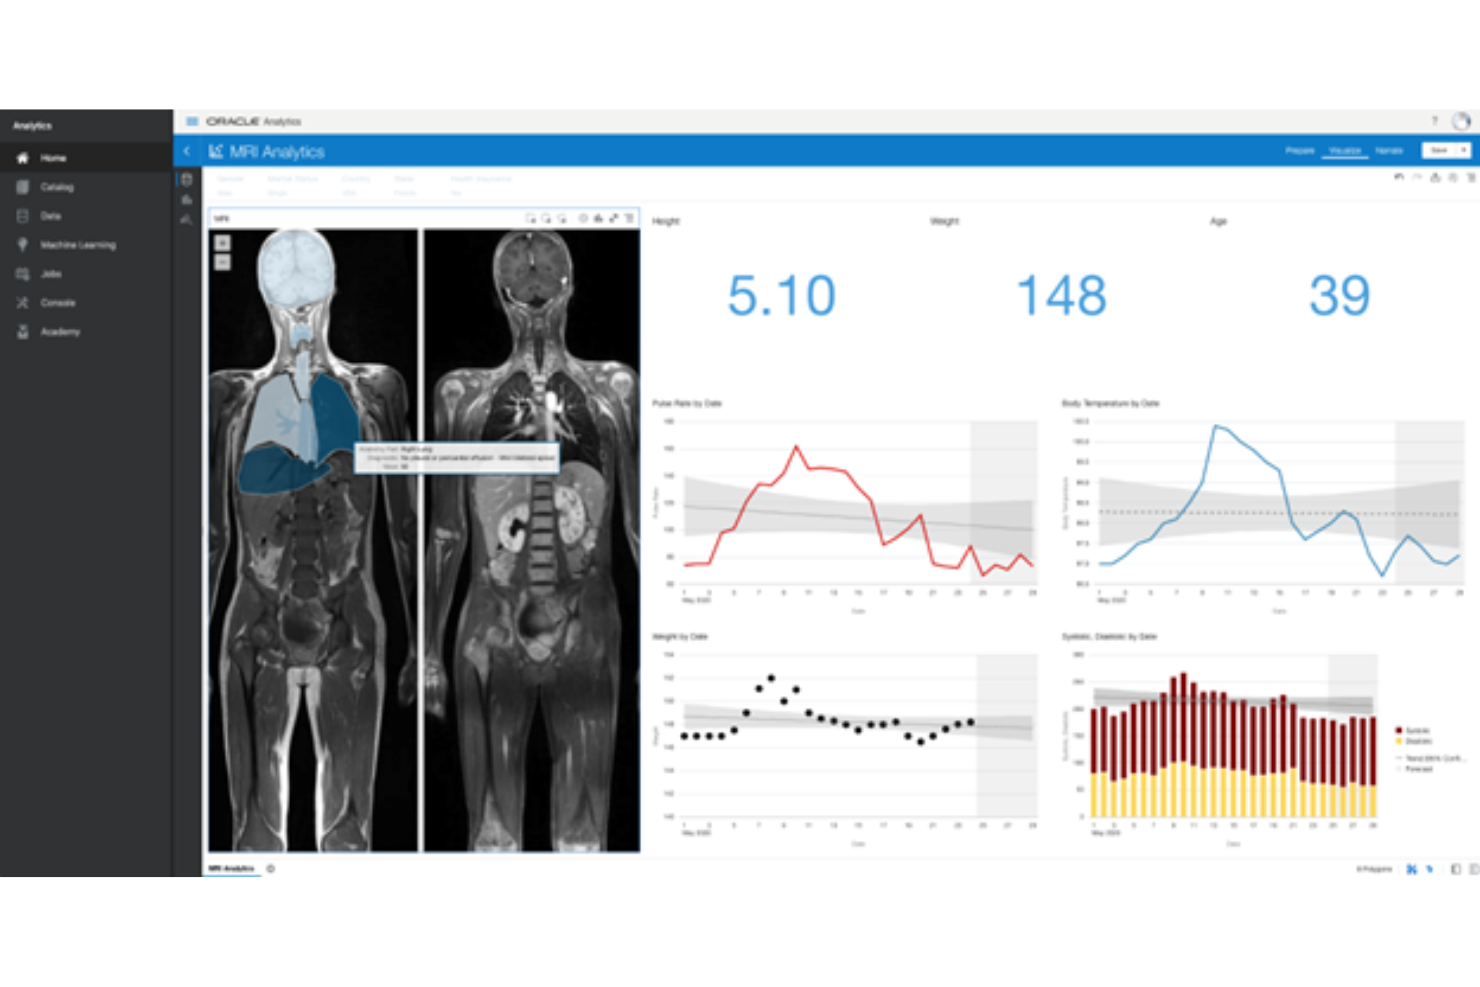
This cloud native BI service is designed to help your organization discover and unlock actionable insights from your data through powerful data preparation and enrichment, as well as data visualization and embedded machine learning. Oracle Analytics Cloud provides on-premise, cloud, and hybrid deployment strategies.
Why I picked Oracle Analytics Cloud: I like this platform because it offers flexible implementation options to meet your needs. While many smaller businesses that can’t afford hardware costs may prefer cloud implementation, enterprise organizations who prefer more control over their data can opt for on-premise deployment.
Oracle Analytics Cloud Standout Features and Integrations
Standout features include machine learning capabilities to surface hidden insights, autonomous data warehouse to optimize analytic workloads, and a mobile app that can learn from your behaviors and make recommendations.
Integrations include Accountagility ORYX, DataTerrain, Espresso, iOS14, Kodiak Hub, Microsoft Azure, Microsoft PowerPoint, Rayven, TSM, and VKS.
Pros and Cons
Pros:
- User-friendly interface design
- Very accessible with limited coding requirements
- You need minimal training to use it
Cons:
- Limited scaling up and down instances
- Limited customization options
Altri Strumenti di BI Self-Service
Ecco alcune alternative di strumenti di BI self-service che non sono entrate nella mia shortlist, ma che meritano comunque di essere considerate:
- Microsoft Power BI
For turning data into visualizations using AI
- Networked BI
For delivering data as a service (DaaS)
- Qlik Analytics Platform
For supporting developers with direct access to the Qlik Associative Engine
- Pyramid Analytics
For augmented consumer and business analyst use cases
- AnswerRocket
For an AI assistant that’s powered by GPT-4
- SAP Analytics Cloud
Advanced analytics tools with smooth access to heterogeneous data sources
- ThoughtSpot
Business intelligence software for an intuitive, Google-like search user interface
- Sisense
Versatile solution for all teams with pro-code, low-code, and no-code options
- Yellowfin BI
For interactive visualizations and action-based dashboards based on AI-assisted analytics
- Tableau Desktop
For building a data-driven culture with decision-making inspired by analytics


Criteri di Selezione degli Strumenti di BI Self-Service
Nella selezione dei migliori strumenti di BI self-service inclusi in questa lista, ho considerato le esigenze comuni degli acquirenti e i punti dolenti più diffusi, come la facilità d’uso e la capacità di integrazione dei dati. Ho anche utilizzato il seguente schema per rendere la valutazione strutturata ed equa:
Funzionalità Principali (25% del punteggio totale)
Per essere inclusa in questa lista, ogni soluzione doveva rispondere a questi casi d’uso comuni:
- Generazione di report e dashboard
- Supporto per analisi ad-hoc
- Visualizzazione dei dati
- Esplorazione dei dati
- Possibilità di condividere e collaborare sui dati
Funzionalità Distintive Aggiuntive (25% del punteggio totale)
Per restringere ulteriormente la selezione, ho valutato anche alcune caratteristiche uniche, come:
- Elaborazione del linguaggio naturale
- Analisi guidata dall’intelligenza artificiale
- Accessibilità da dispositivi mobili
- Dashboard personalizzabili
- Analisi dei dati in tempo reale
Usabilità (10% del punteggio totale)
Per valutare l’usabilità di ciascun sistema, ho considerato i seguenti aspetti:
- Interfaccia intuitiva
- Navigazione semplice
- Curva di apprendimento minima
- Design responsivo
- Esperienza utente coerente
Onboarding (10% del punteggio totale)
Per valutare l’esperienza di onboarding di ogni piattaforma, ho preso in considerazione:
- Disponibilità di video formativi
- Tour interattivi del prodotto
- Accesso a template
- Chatbot di supporto
- Webinar programmati
Assistenza Clienti (10% del punteggio totale)
Per valutare i servizi di assistenza clienti dei vari fornitori ho considerato i seguenti aspetti:
- Disponibilità 24/7
- Canali di supporto multipli
- Tempo di risposta
- Personale competente
- Accesso a un centro assistenza
Rapporto qualità-prezzo (10% del punteggio totale)
Per valutare il rapporto qualità-prezzo di ciascuna piattaforma, ho considerato i seguenti aspetti:
- Prezzi competitivi
- Piani di abbonamento flessibili
- Modello di prezzi trasparente
- Funzionalità incluse nel prezzo base
- Sconti per team più numerosi
Recensioni dei clienti (10% del punteggio totale)
Per avere un'idea della soddisfazione complessiva della clientela, ho considerato questi fattori nella lettura delle recensioni:
- Valutazione complessiva della soddisfazione
- Frequenza degli aggiornamenti
- Funzionalità comunemente apprezzate
- Problemi o bug segnalati
- Feedback sull'assistenza clienti
Come scegliere uno strumento di BI self-service
È facile perdersi tra lunghe liste di funzionalità e strutture di prezzo complesse. Per aiutarti a rimanere focalizzato durante il tuo personale processo di selezione software, ecco un elenco dei fattori principali da considerare:
| Fattore | Cosa considerare |
|---|---|
| Scalabilità | Lo strumento crescerà con la tua azienda? Valuta se può gestire volumi di dati e utenti maggiori. Cerca piani flessibili che accompagnino la tua crescita. |
| Integrazioni | Si collega ai tuoi sistemi esistenti? Assicurati che supporti il tuo CRM, ERP o altro software essenziale. Verifica la disponibilità di API e partner. |
| Personalizzazione | Puoi adattarlo al tuo flusso di lavoro? Scegli strumenti che consentano dashboard e report personalizzati. Evita soluzioni rigide che non si adattano alle tue necessità. |
| Facilità d'uso | È intuitivo per il tuo team? Prova l’interfaccia per valutarne semplicità e immediatezza. Evita strumenti con una curva di apprendimento ripida. |
| Implementazione e onboarding | Quanto velocemente puoi iniziare? Considera la disponibilità di risorse formative, il supporto durante la configurazione e il tempo richiesto per essere operativo. |
| Costo | Rientra nel tuo budget? Analizza il costo totale di proprietà, compresi eventuali costi nascosti o supplementari. Confronta il valore con i concorrenti. |
| Salvaguardie di sicurezza | I tuoi dati sono protetti? Verifica che rispetti gli standard di settore per la crittografia e la privacy. Accertati della conformità a regolamentazioni come il GDPR, se applicabile. |
Cosa sono gli strumenti di BI self-service?
Gli strumenti di BI self-service (Business Intelligence) sono applicazioni software che consentono agli utenti non tecnici di accedere, analizzare e visualizzare i dati in modo autonomo. Questi strumenti offrono un'interfaccia user-friendly, capacità di visualizzazione dati e funzionalità drag-and-drop per la creazione e l'analisi dei report. Integrano diverse fonti di dati e forniscono accesso a dati in tempo reale, permettendo agli utenti di tutta l’organizzazione di svolgere in autonomia analisi e reportistica.
Funzionalità
Quando scegli uno strumento di BI self-service, presta attenzione alle seguenti funzionalità chiave:
- Visualizzazione dati: consente agli utenti di creare rappresentazioni visive dei dati, facilitando l’interpretazione rapida delle informazioni complesse.
- Report ad hoc: permette agli utenti di generare report all’occorrenza, offrendo flessibilità nell’analisi dei dati senza necessità di modelli predefiniti.
- Interfaccia intuitiva: garantisce l’accessibilità dello strumento anche per utenti non tecnici, riducendo la curva di apprendimento e incentivando l’adozione.
- Dashboard personalizzabili: consente agli utenti di adattare le dashboard mostrando i dati più rilevanti e migliorando il monitoraggio dei KPI.
- Integrazione dati: supporta le connessioni a diverse fonti di dati, garantendo un flusso informativo continuo e analisi complete.
- Elaborazione in linguaggio naturale: consente agli utenti di interagire con i dati tramite query in linguaggio naturale, facilitando l’esplorazione delle informazioni.
- Accessibilità mobile: offre la possibilità di consultare dati e insight da dispositivi mobili, abilitando decisioni anche in mobilità.
- Analisi dei dati in tempo reale: fornisce insight aggiornati, permettendo agli utenti di prendere decisioni tempestive e informate.
- Insight guidati dall’IA: utilizza l’intelligenza artificiale per fornire analisi predittive e scoprire tendenze nascoste tra i dati.
- Salvaguardie di sicurezza: assicura privacy e protezione dei dati, rispettando standard di settore e requisiti normativi.
Vantaggi
L’implementazione di strumenti di BI self-service apporta diversi vantaggi al tuo team e alla tua azienda. Ecco alcuni benefici a cui puoi ambire:
- Decisioni più rapide: Grazie all'analisi dei dati in tempo reale, il tuo team può prendere decisioni informate rapidamente senza attendere i report.
- Maggiore accessibilità: Interfacce intuitive e accesso mobile assicurano che tutti nel tuo team possano accedere alle informazioni ovunque e in qualsiasi momento.
- Collaborazione migliorata: Le funzionalità di condivisione dei dati permettono al team di lavorare insieme su insight e strategie in modo più efficace.
- Più flessibilità: Dashboard personalizzabili e reportistica ad hoc consentono agli utenti di adattare lo strumento alle proprie esigenze e domande specifiche.
- Utenti più autonomi: L'elaborazione del linguaggio naturale e i suggerimenti basati su AI permettono anche agli utenti non tecnici di esplorare i dati e individuare trend in autonomia.
- Migliore accuratezza dei dati: L'integrazione con diverse fonti di dati garantisce che le tue analisi si basino su informazioni complete e aggiornate.
Costi & Prezzi
La scelta di strumenti BI self-service richiede la comprensione dei vari modelli e piani di prezzo disponibili. I costi variano in base alle funzionalità, alla dimensione del team, agli extra e altro ancora. La tabella seguente riassume i piani più comuni, i prezzi medi e le caratteristiche tipiche incluse nelle soluzioni di strumenti BI self-service:
Tabella di confronto dei piani per strumenti BI self-service
| Tipo di piano | Prezzo medio | Caratteristiche comuni |
|---|---|---|
| Piano gratuito | $0 | Visualizzazione base dei dati, fonti dati limitate e supporto della community. |
| Piano personale | $10-$30/user/month | Reportistica ad hoc, dashboard personalizzabili e supporto via email. |
| Piano Business | $30-$60/user/month | Integrazione avanzata dei dati, accesso mobile e supporto prioritario. |
| Piano Enterprise | $60-$120/user/month | Suggerimenti basati su AI, account manager dedicato e funzionalità di sicurezza complete. |
Domande frequenti sugli strumenti BI self-service
Ecco alcune risposte alle domande più comuni sugli strumenti BI self-service:
Qual è la differenza tra strumenti BI self-service e strumenti BI tradizionali?
Gli strumenti BI self-service permettono agli utenti senza competenze tecniche di accedere e analizzare i dati in autonomia, mentre quelli tradizionali richiedono spesso l’intervento dell’IT per la generazione dei report. Gli strumenti self-service sono user-friendly e abilitano insight rapidi e decisioni tempestive, mentre quelli tradizionali sono di solito più complessi e orientati all’IT.
Gli strumenti BI self-service possono gestire grandi set di dati?
Sì, molti strumenti BI self-service possono gestire grandi volumi di dati, ma le prestazioni dipendono dall’architettura dello strumento e dalle risorse del sistema. Cerca soluzioni con capacità di elaborazione scalabili e verifica che integrino bene la tua infrastruttura dati esistente per gestire grandi quantità in modo efficiente.
Come si integrano gli strumenti BI self-service con altri software?
Gli strumenti BI self-service offrono generalmente connessioni API o integrazioni preconfigurate con software diffusi come CRM, ERP e database. Prima di scegliere uno strumento, verifica la compatibilità con i tuoi sistemi per assicurare un flusso dati senza problemi e evitare possibili sfide d’integrazione.
Come si testa la scalabilità negli strumenti BI self-service?
Esegui query su grandi set di dati per vedere come lo strumento gestisce carichi di lavoro pesanti. Testa i tempi di caricamento delle dashboard e monitora le prestazioni man mano che più utenti accedono al sistema.
Come si può monitorare l’uso e l’adozione degli strumenti BI self-service?
Utilizza le analisi integrate dello strumento per vedere chi crea report e quali dashboard ricevono più visualizzazioni. Questi insight aiutano a calibrare la formazione e favorire l’adozione del team.
Prossimi passi:
Se stai cercando informazioni sugli strumenti BI self-service, contatta gratuitamente un consulente SoftwareSelect per ricevere raccomandazioni personalizzate.
Compili un modulo e fai una breve conversazione in cui il consulente approfondisce le tue necessità specifiche. Riceverai così una lista ristretta di software da valutare. Ti seguiranno anche durante tutto il processo di acquisto, comprese le negoziazioni sui prezzi.